
User's Manual


711 | Spectrum Analysis Dell Networking W-Series ArubaOS 6.4.x| User Guide
After you have selected the initial spectrum monitor or hybrid AP for a graph, you can display data for a
different spectrum device at any time by clicking the down arrow by the device name in the chart titlebar and
selecting a different connected spectrum monitor or hybrid AP.
Changing Graphs within a Spectrum View
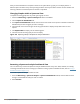
To replace an existing graph with any other type of graph or chart:
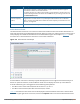
1. Access the Monitoring > Spectrum Analysis window in the WebUI.
2. Click the Spectrum Dashboards tab.
3. From Spectrum Dashboards window, click one of the view names at the top of the window to select the
dashboard layout with the graph you want to change.
4. Click the down arrow at the far right end of the graph title bar to display a drop-down menu of chart
options.
5. Click Replace With to display a list of available graphs.
6. Click the name of the new graph you want to display.
Figure 103 Replacing a Graph in the Spectrum Analysis Dashboard
Renaming a Spectrum Analysis Dashboard View
You can rename any of the three spectrum analysis dashboard views at any time. Note, however, that simply
renaming a view does not save its settings. (For details on saving a spectrum dashboard view, refer to Saving a
Dashboard View on page 712.)
To rename a Spectrum Analysis Dashboard view:
1. From the Monitoring > Spectrum Analysis > Spectrum Dashboards window, click the down arrow to
the right of the dashboard view you want to rename.
2. Select Rename.