
User's Manual
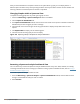


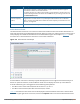


You can save the data in the Active Devices table for later analysis by exporting it as data file in .csv format,
which can be viewed by spreadsheet and database management applications like Microsoft Excel. To export
this table, click the down arrow in the upper right corner of this chart and select Export. A window opens and
lets you browse to the location to which you want to save the file. Once you have identified the location where
you want to save the file, click Save.
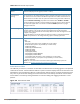
You can also filter table entries by signal strength, duty cycle, discovery time, activity duration, channels
affected and device ID number by clicking the icon below any column heading and specifying the values or
value ranges that should appear in the table. Table 136 describes each of the columns in the table and the
filters that can be applied to the table output.
Parameter Description
Device Type This column shows the type of active device detected by the spectrum monitor or
hybrid AP. This column may display any of the following values:
l WiFi (AP)
l Microwave (This option is only available for 2.4 GHz radios)
l Bluetooth (This option is only available for 2.4 GHz radios)
l Fixed Freq (Others)
l Fixed Freq (Cordless Phones)
l Fixed Freq (Video)
l Fixed Freq (Audio)
l Freq Hopper (Others)
l Freq Hopper (Cordless Network)
l Freq Hopper (Cordless Base)
l Freq Hopper Xbox (This option is only available for 2.4 GHz radios)
l Microwave (Inverter) (This option is only available for 2.4 GHz radios)
l Generic Interferer
NOTE: For more information on non-Wi-Fi device types detected by a spectrum
monitor, see Working with Non-Wi-Fi Interferers on page 739.
BSSID The Basic Service Set Identifier of the device. An AP’s BSSID is usually its MAC
address.
SSID The service set identifier of the device’s 802.11 wireless LAN.
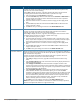
Signal (dBm) The current transmission power for this device, in dBm.
To filter the output of this table to show only specific device types, click the icon in the
column heading then select one of the following options:
l Select Any to display entries for all signal strength levels.
l To display entries within a specific range of power strength levels, enter the
minimum signal strength level in the Min field and enter the maximum signal
strength level in the Max field.
Click OK to save your settings and return to the Active Devices table.
Duty Cycle The percentage of time that the device is actively sending a signal on the radio band
or channel.
To filter the output of this table to show only specific duty cycle values or a range of
values types, click the icon in the column heading then select one of the following
options:
l Select Any to display all entries, regardless of duty cycle value.
l To display entries within a specific range of duty cycles, enter the minimum duty
cycle percentage in the Min field and enter the maximum duty cycle percentage
in the Max field.
Click OK to save your settings and return to the Active Devices table.
Discovered The time at which the device was first discovered by the spectrum monitor or hybrid
AP.
Table 136: Active Devices Table Options
Dell Networking W-Series ArubaOS 6.4.x | User Guide Spectrum Analysis | 716