
User's Manual


723 | Spectrum Analysis Dell Networking W-Series ArubaOS 6.4.x| User Guide
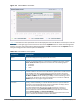
Channel Summary Table
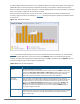
The channel summary table provides a summarized or aggregated view of key statistics. Spectrum monitors
display spectrum analysis data seen on all channels in the selected band, and hybrid APs display data from the
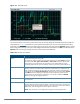
one channel they are monitoring. The example in Figure 113 below shows that a spectrum monitor sees 44
Valid APs and 52% channel utilization on channel 40 in the 5GHz radio band.
Figure 113 Channel Summary Table
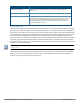
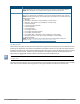
Spectrum monitor radios using the 5 GHz radio band can display channels using either 20 MHz or 40 MHz
channel numbering. Spectrum monitor radios that support 802.11ac can also display 80MHz channels. To
toggle between these channel numbering modes, click the down arrow in the upper right corner of the graph
titlebar, then click either Show 20 MHz Channels, Show 40 MHz Channels or Show 80 MHz Channels.
Click any of the column headings to sort the information in the table by that column criteria. Make a column
wider or narrower by clicking the border of a column heading and dragging the border to a new position.
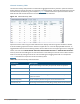
Table 140 describes the output of the Channel Summary table.
Parameter Description
Channel Radio channel being monitored by the spectrum monitor or hybrid AP
Valid APs Number of known APs seen on the network.
Not Valid APs Number of unknown or invalid APs seen on the network.
Non Wi-Fi Devices Number of Non-Wi-Fi (interfering) devices detected/classified by the
spectrum monitor.
Center Freq. (GHz) Center frequency of the Wi-Fi signals sent on that radio channel.
Channel Util. (%) Percentage of the channel currently being used by devices on the network.
Table 140: Channel Summary Table Parameters