
User's Manual


727 | Spectrum Analysis Dell Networking W-Series ArubaOS 6.4.x| User Guide
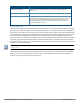
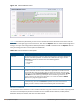
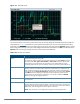
Figure 115 Channel Utilization Trend
Table 142 describes the parameters you can use to customize the Channel Utilization Trend chart. Click the
down arrow in the upper right corner of this chart, then click the Options menu to access these configuration
settings. Once you have configured the desired parameters, click OK at the bottom of the Options menu to
save your settings and return to the spectrum dashboards.
Parameter Description
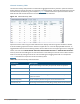
Intervals The Channel Utilization Trend chart shows channel quality or channel availability for
the past 10 minutes by default. To view data for a different time range, click the
Intervals drop-down list and select one of the following options:
l 10 minutes
l 30 minutes
l 1 hour
Band Radio band displayed in this graph (2.4 GHz or 5 GHz).
Channel Numbering This parameter is not configurable for graphs created by hybrid APs or spectrum
monitor radios that use the 2.4 GHz radio band. A hybrid AP on a 20 MHz channel
sees 40 MHz Wi-Fi data as non-Wi-Fi data. For spectrum monitors using the 5 GHz
radio band, click the Channel Numbering drop-down list and select either 20 MHz
or 40 MHz channel numbering to identify a channel numbering scheme for the
graph. Graphs for AP radios that support 802.11ac include an additional 80MHz
option for very-high-throughput channels.
Show To select individual channels you want to display on this chart, click the checkbox by
a channel entry, then click the channel drop-down list to select the channel to
display. To hide a channel, uncheck the checkbox by that channel number.
Table 142: Channel Utilization Trend Options
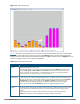
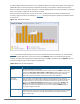
Devices vs Channel
This stacked bar chart shows the current number of devices using each channel in the radio’s frequency band.
This chart can show separate per-channel statistics for the numbers of Wi-Fi devices, cordless phones,
bluetooth devices, microwaves, and other non-Wi-Fi devices.