
User's Manual


737 | Spectrum Analysis Dell Networking W-Series ArubaOS 6.4.x| User Guide
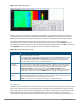
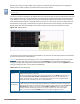
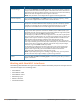
Figure 121 Simple Line Graph of FFT Power Data
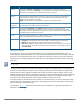
Now, suppose that each channel’s FFT power level was also represented by a color that corresponded to that
specific FFT power level. In the example below, channel 12 has a FFT power level of -50 dBm, represented by
the color red. Channel 1 has a FFT power level of -85 dBm, represented by dark blue.
Figure 122 FFT Power Line Graph with Color
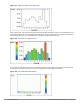
If the graph was then flattened so each channel’s FFT power for that single1-second sweep was represented
only by a color (and not by a value on the y-axis), the graph could then appear as follows:
Figure 123 FFT Power Spectrogram Sample