
User's Manual


776 | Dashboard Monitoring Dell Networking W-Series ArubaOS 6.4.x| User Guide
Chart View
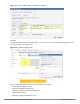
A new UCC tab is introduced under the Dashboard tab. Navigate to the Dashboard > UCC page to view UCC
dashboard. Clicking the UCC hyperlink displays the following characteristics (in graphical format) of the UCC
deployment.
Figure 160 UCC Dashboard
n Call Volume – This graph displays the total number of calls made based on the UCC application type.
For example, SIP, Lync, SCCP, H.323, NOE, SVP, VOCERA, and FaceTime.
n Call Quality – This graph displays the number of UCC calls categorized by the following call quality:
n Good
n Fair
n Poor
n Unknown
n Call Quality vs. Client Health - This graph displays the co-relation between the VoIP call quality and
the VoIP client health of every UCC call.
n Calls Per Device Type – This graph displays the calls made per device type. For example, Windows 7,
Mac OS X, iPhone, or Android.
n Roaming – Roaming status of UCC clients. The status can be:
n No – Number of calls where the client did not roam to a new AP.
n Yes - Number of calls where the client has roamed to a new AP.
n Unknown - Unknown calls.
n QoS Correction – If the DSCP value of the Real-time Transport Protocol (RTP)packets sent by the client
differs from the recommended QoS setting, the call is classified as QoS Corrected. This graph displays the
number of UCC calls where the controller has corrected the DSCP QoS value for such calls. The QoS
correction is categorized as:
n No – No UCC QoS call correction.
n Yes – DSCP QoS value corrected by the controller.
n Unknown – Unknown calls.
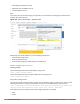
Details View
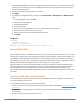
Navigate to the Dashboard > UCC page. To display an aggregated list of all the UCC call data metrics in the
controller, click any of the following hyperlinks: