
Users Guide

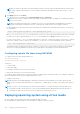
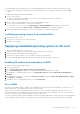
Table Of Contents
- Integrated Dell Remote Access Controller 9 User's Guide
- Contents
- Overview of iDRAC
- Benefits of using iDRAC
- Key features
- New features added
- How to use this guide
- Supported web browsers
- iDRAC licenses
- Licensed features in iDRAC9
- Interfaces and protocols to access iDRAC
- iDRAC port information
- Other documents you may need
- Contacting Dell
- Accessing documents from Dell support site
- Accessing Redfish API Guide
- Logging in to iDRAC
- Force Change of Password (FCP)
- Logging into iDRAC using OpenID Connect
- Logging in to iDRAC as local user, Active Directory user, or LDAP user
- Logging in to iDRAC as a local user using a smart card
- Logging in to iDRAC using Single Sign-On
- Accessing iDRAC using remote RACADM
- Accessing iDRAC using local RACADM
- Accessing iDRAC using firmware RACADM
- Simple 2-Factor Authentication (Simple 2FA)
- RSA SecurID 2FA
- Viewing system health
- Logging in to iDRAC using public key authentication
- Multiple iDRAC sessions
- Secure default password
- Changing the default login password
- Enabling or disabling default password warning message
- Password Strength Policy
- IP Blocking
- Enabling or disabling OS to iDRAC Pass-through using web interface
- Enabling or disabling alerts using RACADM
- Setting up managed system
- Setting up iDRAC IP address
- Modifying local administrator account settings
- Setting up managed system location
- Optimizing system performance and power consumption
- Setting up management station
- Configuring supported web browsers
- Configuring Internet Explorer
- Configuring Mozilla Firefox
- Configuring web browsers to use virtual console
- Viewing localized versions of web interface
- Updating device firmware
- Updating firmware using iDRAC web interface
- Scheduling automatic firmware updates
- Updating device firmware using RACADM
- Updating firmware using CMC web interface
- Updating firmware using DUP
- Updating firmware using remote RACADM
- Updating firmware using Lifecycle Controller Remote Services
- Updating CMC firmware from iDRAC
- Viewing and managing staged updates
- Rolling back device firmware
- Monitoring iDRAC using other Systems Management tools
- Support Server Configuration Profile — Import and Export
- Secure Boot Configuration from BIOS Settings or F2
- BIOS recovery
- Configuring iDRAC
- Viewing iDRAC information
- Modifying network settings
- Cipher suite selection
- FIPS mode
- Configuring services
- Using VNC client to manage remote server
- Configuring front panel display
- Configuring time zone and NTP
- Setting first boot device
- Enabling or disabling OS to iDRAC Pass-through
- Obtaining certificates
- Configuring multiple iDRACs using RACADM
- Disabling access to modify iDRAC configuration settings on host system
- Delegated Authorization using OAuth 2.0
- Viewing iDRAC and managed system information
- Viewing managed system health and properties
- Configuring Asset Tracking
- Viewing system inventory
- Viewing sensor information
- Monitoring performance index of CPU, memory, and input output modules
- Idle Server Detection
- GPU (Accelerators) Management
- Checking the system for Fresh Air compliance
- Viewing historical temperature data
- Viewing network interfaces available on host OS
- Viewing network interfaces available on host OS using RACADM
- Viewing FlexAddress mezzanine card fabric connections
- Viewing or terminating iDRAC sessions
- Setting up iDRAC communication
- Communicating with iDRAC through serial connection using DB9 cable
- Configuring BIOS for serial connection
- Enabling RAC serial connection
- Enabling IPMI serial connection basic and terminal modes
- Switching between RAC serial and serial console while using DB9 cable
- Communicating with iDRAC using IPMI SOL
- Communicating with iDRAC using IPMI over LAN
- Enabling or disabling remote RACADM
- Disabling local RACADM
- Enabling IPMI on managed system
- Configuring Linux for serial console during boot in RHEL 6
- Configuring serial terminal in RHEL 7
- Supported SSH cryptography schemes
- Communicating with iDRAC through serial connection using DB9 cable
- Configuring user accounts and privileges
- iDRAC user roles and privileges
- Recommended characters in user names and passwords
- Configuring local users
- Configuring Active Directory users
- Prerequisites for using Active Directory authentication for iDRAC
- Supported Active Directory authentication mechanisms
- Standard schema Active Directory overview
- Configuring Standard schema Active Directory
- Extended schema Active Directory overview
- Configuring Extended schema Active Directory
- Extending Active Directory schema
- Installing Dell extension to the Active Directory users and computers snap-in
- Adding iDRAC users and privileges to Active Directory
- Configuring Active Directory with Extended schema using iDRAC web interface
- Configuring Active Directory with Extended schema using RACADM
- Testing Active Directory settings
- Configuring generic LDAP users
- System Configuration Lockdown mode
- Configuring iDRAC for Single Sign-On or smart card login
- Prerequisites for Active Directory Single Sign-On or smart card login
- Configuring iDRAC SSO login for Active Directory users
- Enabling or disabling smart card login
- Configuring Smart Card Login
- Using Smart Card to Login
- Configuring iDRAC to send alerts
- Enabling or disabling alerts
- Filtering alerts
- Setting event alerts
- Setting alert recurrence event
- Setting event actions
- Configuring email alert, SNMP trap, or IPMI trap settings
- Configuring WS Eventing
- Configuring Redfish Eventing
- Monitoring chassis events
- Alerts message IDs
- iDRAC 9 Group Manager
- Managing logs
- Monitoring and managing power in iDRAC
- iDRAC Direct Updates
- Inventorying, monitoring, and configuring network devices
- Inventorying and monitoring network devices
- Inventorying and monitoring FC HBA devices
- Inventorying and monitoring SFP Transceiver devices
- Telemetry Streaming
- Serial Data Capture
- Dynamic configuration of virtual addresses, initiator, and storage target settings
- Supported cards for IO Identity Optimization
- Supported NIC firmware versions for IO Identity Optimization
- Virtual or Remote assigned Address and Persistence Policy behavior when iDRAC is set to Remote-Assigned Address mode or Console mode
- System behavior for FlexAddress and IO Identity
- Enabling or disabling IO Identity Optimization
- SSD Wear Threshold
- Configuring persistence policy settings
- Managing storage devices
- Understanding RAID concepts
- Supported controllers
- Supported enclosures
- Summary of supported features for storage devices
- Inventorying and monitoring storage devices
- Viewing storage device topology
- Managing physical disks
- Managing virtual disks
- RAID Configuration Features
- Managing controllers
- Configuring controller properties
- Importing or auto importing foreign configuration
- Clearing foreign configuration
- Resetting controller configuration
- Switching the controller mode
- 12 Gbps SAS HBA adapter operations
- Monitoring predictive failure analysis on drives
- Controller operations in non-RAID mode or HBA mode
- Running RAID configuration jobs on multiple storage controllers
- Manage Preserved cache
- Managing PCIe SSDs
- Managing enclosures or backplanes
- Choosing operation mode to apply settings
- Viewing and applying pending operations
- Storage devices — apply operation scenarios
- Blinking or unblinking component LEDs
- Warm reboot
- BIOS Settings
- Configuring and using virtual console
- Supported screen resolutions and refresh rates
- Configuring virtual console
- Previewing virtual console
- Launching virtual console
- Using virtual console viewer
- eHTML5 based virtual console
- HTML5 based virtual console
- Synchronizing mouse pointers
- Passing all keystrokes through virtual console for Java or ActiveX plug-in
- Using iDRAC Service Module
- Using USB port for server management
- Using Quick Sync 2
- Managing virtual media
- Managing vFlash SD card
- Configuring vFlash SD card
- Managing vFlash partitions
- Using SMCLP
- Deploying operating systems
- Troubleshooting managed system using iDRAC
- Using diagnostic console
- Viewing post codes
- Viewing boot and crash capture videos
- Viewing logs
- Viewing last system crash screen
- Viewing System status
- Hardware trouble indicators
- Viewing system health
- Checking server status screen for error messages
- Restarting iDRAC
- Reset to Custom Defaults (RTD)
- Erasing system and user data
- Resetting iDRAC to factory default settings
- SupportAssist Integration in iDRAC
- Frequently asked questions
- System Event Log
- Custom sender email configuration for iDRAC alerts
- Network security
- Telemetry streaming
- Active Directory
- Single Sign-On
- Smart card login
- Virtual console
- Virtual media
- vFlash SD card
- SNMP authentication
- Storage devices
- GPU (Accelerators)
- iDRAC Service Module
- RACADM
- Permanently setting the default password to calvin
- Miscellaneous
- Use case scenarios
- Troubleshooting an inaccessible managed system
- Obtaining system information and assess system health
- Setting up alerts and configuring email alerts
- Viewing and exporting System Event Log and Lifecycle Log
- Interfaces to update iDRAC firmware
- Performing graceful shutdown
- Creating new administrator user account
- Launching servers remote console and mounting a USB drive
- Installing bare metal OS using attached virtual media and remote file share
- Managing rack density
- Installing new electronic license
- Applying IO Identity configuration settings for multiple network cards in single host system reboot

Troubleshooting managed system using
iDRAC
You can diagnose and troubleshoot a remote managed system using:
● Diagnostic console
● Post code
● Boot and crash capture videos
● Last system crash screen
● System event logs
● Lifecycle logs
● Front panel status
● Trouble indicators
● System health
Topics:
• Using diagnostic console
• Viewing post codes
• Viewing boot and crash capture videos
• Viewing logs
• Viewing last system crash screen
• Viewing System status
• Hardware trouble indicators
• Viewing system health
• Checking server status screen for error messages
• Restarting iDRAC
• Reset to Custom Defaults (RTD)
• Erasing system and user data
• Resetting iDRAC to factory default settings
Using diagnostic console
iDRAC provides a standard set of network diagnostic tools that are similar to the tools included with Microsoft Windows or
Linux-based systems. Using iDRAC Web interface, you can access the network debugging tools.
To access Diagnostics Console:
1. In the iDRAC Web interface, go to Maintenance > Diagnostics.
The Diagnostics Console Command page is displayed.
2. In the Command text box, enter a command and click Submit. For information about the commands, see the iDRAC Online
Help.
The results are displayed on the same page.
Reset iDRAC and Reset iDRAC to default
1. In the iDRAC Web interface, go to Maintenance > Diagnostics.
You have the following options:
● Click Reset iDRAC to reset the iDRAC. A normal reboot operation is performed on the iDRAC. After reboot, refresh the
browser to reconnect and log in to iDRAC.
27
330 Troubleshooting managed system using iDRAC