
Users Guide
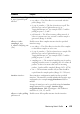
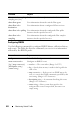
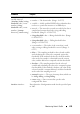
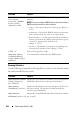
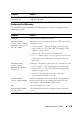
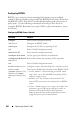
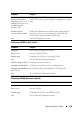
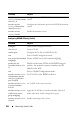
Table Of Contents
- Introduction
- Switch Feature Overview
- System Management Features
- Multiple Management Options
- System Time Management
- Log Messages
- System Reset
- Integrated DHCP Server
- Management of Basic Network Information
- IPv6 Management Features
- Dual Software Images
- File Management
- Switch Database Management Templates
- Automatic Installation of Firmware and Configuration
- sFlow
- SNMP Alarms and Trap Logs
- CDP Interoperability Through ISDP
- Remote Monitoring (RMON)
- Stacking Features
- Security Features
- Configurable Access and Authentication Profiles
- Password-Protected Management Access
- Strong Password Enforcement
- TACACS+ Client
- RADIUS Support
- SSH/SSL
- Inbound Telnet Control
- Denial of Service
- Port Protection
- Captive Portal
- 802.1X Authentication (IEEE 802.1X)
- MAC-Based 802.1X Authentication
- 802.1X Monitor Mode
- Port Security
- Access Control Lists (ACLs)
- Time-Based ACLs
- IP Source Guard (IPSG)
- DHCP Snooping
- Dynamic ARP Inspection
- Protected Ports (Private VLAN Edge)
- Green Technology Features
- Power over Ethernet (PoE) Features
- PD Detection
- Legacy (Reduced Capacitor) Detection
- Classification
- Port Start Up
- Overload Detection and Port Shutdown
- Disconnect Detection
- IC Thermal Monitoring
- Over-Temperature Protection
- 4-Pair Ports
- IEEE 802.3bt Capability
- PoE Port Capabilities and Power Limits
- Key PoE Plus Features
- Power Over Ethernet (PoE) Support
- PoE Plus Support
- PoE 60W Support
- Powered Device Detection
- PoE Power Management Modes
- Power Management in Guard Band
- PoE Plus Default Settings
- Switching Features
- Flow Control Support (IEEE 802.3x)
- Head of Line Blocking Prevention
- Jumbo Frames Support
- Auto-MDI/MDIX Support
- VLAN-Aware MAC-based Switching
- Back Pressure Support
- Auto-negotiation
- Storm Control
- Port Mirroring
- Static and Dynamic MAC Address Tables
- Link Layer Discovery Protocol (LLDP)
- Link Layer Discovery Protocol (LLDP) for Media Endpoint Devices
- Connectivity Fault Management (IEEE 802.1ag)
- Cisco Protocol Filtering
- DHCP Layer-2 Relay
- Virtual Local Area Network Supported Features
- Spanning Tree Protocol Features
- Link Aggregation Features
- Routing Features
- Address Resolution Protocol (ARP) Table Management
- VLAN Routing
- IP Configuration
- Open Shortest Path First (OSPF)
- Border Gateway Protocol (BGP)
- Virtual Routing and Forwarding (VRF)
- BOOTP/DHCP Relay Agent
- IP Helper and DHCP Relay
- Routing Information Protocol
- Router Discovery
- Routing Table
- Virtual Router Redundancy Protocol (VRRP)
- Tunnel and Loopback Interfaces
- IPv6 Routing Features
- Quality of Service (QoS) Features
- Layer-2 Multicast Features
- Layer-3 Multicast Features
- System Management Features
- Hardware Overview
- Dell EMC Networking N1100-ON Series Switch Hardware
- Dell EMC Networking N1500 Series Switch Hardware
- Dell EMC Networking N2000 Series Switch Hardware
- Dell EMC Networking N2100-ON Series Switch Hardware
- Dell EMC Networking N2200-ON Series Switch Hardware
- N2200-ON Series Front Panel
- N2200-ON Series Rear Panel
- N2200X-ON Series Switch Ports
- N2200-ON Series Console Port
- N2200-ON Series USB Port
- N2200-ON Series Reset Button
- N2200-ON Series Port and System LEDs
- N2200-ON Series Stack Master LED and Stack Number Display
- N2200-ON Series Power Supplies
- N2200-ON Series LED Definitions
- Dell EMC Networking N3000E-ON Series Switch Hardware
- Dell EMC Networking N3100-ON Series Switch Hardware
- Dell EMC Networking N3200-ON Series Switch Hardware
- N3200-ON Series Front Panel
- N3200-ON Series Rear Panel
- N3200-ON Series Switch Ports
- N3200-ON Series Console Port
- N3200-ON Series USB Port
- N3200-ON Series Reset Button
- N3200-ON Series Port and System LEDs
- N3200-ON Series Stack Master LED and Stack Number Display
- N3200-ON Series Power Supplies
- N3200-ON Series LED Definitions
- Switch MAC Addresses
- Using Dell EMC OpenManage Switch Administrator
- Using the Command-Line Interface
- Default Settings
- Setting the IP Address and Other Basic Network Information
- Stacking
- Stacking Overview
- Dell EMC Networking Stacking Compatibility
- How is the Stack Master Selected?
- Adding a Switch to the Stack
- Removing a Switch from the Stack
- How is the Firmware Updated on the Stack?
- What is Stacking Standby?
- What is Nonstop Forwarding?
- Switch Stack MAC Addressing and Stack Design Considerations
- NSF Network Design Considerations
- Why is Stacking Needed?
- Default Stacking Values
- Managing and Monitoring the Stack (Web)
- Managing the Stack (CLI)
- Stacking and NSF Usage Scenarios
- Stacking Overview
- Authentication, Authorization, and Accounting
- AAA Introduction
- Authentication
- Authorization
- Accounting
- IEEE 802.1X
- What is IEEE 802.1X?
- What are the 802.1X Port Authentication Modes?
- What are Authentication Host Modes
- What is MAC Authentication Bypass?
- What is the Role of 802.1X in VLAN Assignment?
- What is Monitor Mode?
- How Does the Authentication Server Assign DiffServ Policy or ACLs?
- What is the Internal Authentication Server?
- Default 802.1X Values
- Configuring IEEE 802.1X (Web)
- Captive Portal
- Monitoring and Logging System Information
- System Monitoring Overview
- Default Log Settings
- Monitoring System Information and Configuring Logging (Web)
- Device Information
- System Health
- System Resources
- Unit Power Usage History
- Integrated Cable Test for Copper Cables
- Optical Transceiver Diagnostics
- Log Global Settings
- RAM Log
- Log File
- SYSLOG Server
- Email Alert Global Configuration
- Email Alert Mail Server Configuration
- Email Alert Subject Configuration
- Email Alert To Address Configuration
- Email Alert Statistics
- Monitoring System Information and Configuring Logging (CLI)
- Logging Configuration Examples
- Managing General System Settings
- System Settings Overview
- Default General System Information
- Configuring General System Settings (Web)
- System Information
- CLI Banner
- SDM Template Preference
- Clock
- SNTP Global Settings
- SNTP Authentication
- SNTP Server
- Summer Time Configuration
- Time Zone Configuration
- Card Configuration
- Slot Summary
- Supported Cards
- Power Over Ethernet Global Configuration
- Power Over Ethernet Unit Configuration
- Power Over Ethernet Interface Configuration
- Configuring System Settings (CLI)
- General System Settings Configuration Examples
- SNMP
- Images and File Management
- DHCP and USB Auto-Configuration
- Auto Configuration Overview
- What Is USB Auto Configuration?
- What Files Does USB Auto Configuration Use?
- How Does USB Auto Configuration Use the Files on the USB Device?
- What Is the Setup File Format?
- What Is the DHCP Auto Configuration Process?
- Monitoring and Completing the DHCP Auto Configuration Process
- What Are the Dependencies for DHCP Auto Configuration?
- Default Auto Configuration Values
- Managing Auto Configuration (Web)
- Managing Auto Configuration (CLI)
- Auto Configuration Example
- Auto Configuration Overview
- Monitoring Switch Traffic
- Traffic Monitoring Overview
- Default Traffic Monitoring Values
- Monitoring Switch Traffic (Web)
- sFlow Agent Summary
- sFlow Receiver Configuration
- sFlow Sampler Configuration
- sFlow Poll Configuration
- Interface Statistics
- Etherlike Statistics
- GVRP Statistics
- EAP Statistics
- Utilization Summary
- Counter Summary
- Switchport Statistics
- RMON Statistics
- RMON History Control Statistics
- RMON History Table
- RMON Event Control
- RMON Event Log
- RMON Alarms
- Port Statistics
- LAG Statistics
- Port Mirroring
- Monitoring Switch Traffic (CLI)
- Traffic Monitoring Examples
- iSCSI Optimization
- iSCSI Optimization Overview
- What Does iSCSI Optimization Do?
- What Occurs When iSCSI Optimization Is Enabled or Disabled?
- How Does the Switch Detect iSCSI Traffic Flows?
- How Is Quality of Service Applied to iSCSI Traffic Flows?
- How Does iSCSI Optimization Use ACLs?
- What Information Does the Switch Track in iSCSI Traffic Flows?
- How Does iSCSI Optimization Interact With Dell EqualLogic and Compellent Arrays?
- How Does iSCSI Optimization Interact with Other SAN Arrays?
- Default iSCSI Optimization Values
- Configuring iSCSI Optimization (Web)
- Configuring iSCSI Optimization (CLI)
- iSCSI Optimization Configuration Examples
- iSCSI Optimization Overview
- Port Characteristics
- Port and System Security
- Access Control Lists
- VLANs
- VLAN Overview
- Default VLAN Behavior
- Configuring VLANs (Web)
- Configuring VLANs (CLI)
- Creating a VLAN
- Configuring VLAN Settings for a LAG
- Configuring Double VLAN Tagging
- Configuring MAC-Based VLANs
- Configuring IP-Based VLANs
- Configuring a Protocol-Based VLAN
- Configuring GVRP
- Configuring Voice VLANs
- Configuring a Voice VLAN (Extended Example)
- Enterprise Voice VLAN Configuration With QoS
- MLAG with RPVST and Voice VLAN
- Assigning an 802.1p Priority to VLAN Traffic
- Configuring a Private VLAN
- Configuring Inter-Switch Private VLANs
- VLAN Configuration Examples
- Spanning Tree Protocol
- Discovering Network Devices
- Port-Based Traffic Control
- Layer-2 Multicast Features
- L2 Multicast Overview
- Snooping Switch Restrictions
- Default L2 Multicast Values
- Configuring L2 Multicast Features (Web)
- Multicast Global Parameters
- Bridge Multicast Group
- MFDB Summary
- MRouter Status
- General IGMP Snooping
- Global Querier Configuration
- VLAN Querier
- VLAN Querier Status
- MFDB IGMP Snooping Table
- MLD Snooping General
- MLD Snooping Global Querier Configuration
- MLD Snooping VLAN Querier
- MLD Snooping VLAN Querier Status
- MFDB MLD Snooping Table
- MVR Global Configuration
- MVR Members
- MVR Interface Configuration
- MVR Statistics
- GARP Timers
- GMRP Parameters
- MFDB GMRP Table
- Configuring L2 Multicast Features (CLI)
- Case Study on a Real-World Network Topology
- Connectivity Fault Management
- Ethernet Ring Protection
- Ethernet Ring Protection Switching Port Role
- R-APS Channel
- Traffic Channel
- Ring Scope
- Ethernet Ring Protection Port Status
- Ethernet Ring Protection Timers
- Revertive and Non-Revertive Operation Modes
- ERPS Subrings
- Topology Change Notification
- Protection Switching Triggers
- Ring Failure Detection
- Ring Protection Example
- Snooping and Inspecting Traffic
- Traffic Snooping and Inspection Overview
- Default Traffic Snooping and Inspection Values
- Configuring Traffic Snooping and Inspection (Web)
- DHCP Snooping Configuration
- DHCP Snooping Interface Configuration
- DHCP Snooping VLAN Configuration
- DHCP Snooping Persistent Configuration
- DHCP Snooping Static Bindings Configuration
- DHCP Snooping Dynamic Bindings Summary
- DHCP Snooping Statistics
- IPSG Interface Configuration
- IPSG Binding Configuration
- IPSG Binding Summary
- DAI Global Configuration
- DAI Interface Configuration
- DAI VLAN Configuration
- DAI ACL Configuration
- DAI ACL Rule Configuration
- DAI Statistics
- Configuring Traffic Snooping and Inspection (CLI)
- Traffic Snooping and Inspection Configuration Examples
- Link Aggregation
- MAC Addressing and Forwarding
- DHCP Server Settings
- IP Routing
- Routing Interfaces
- Layer-2 and Layer-3 Relay Features
- OSPF and OSPFv3
- OSPF Overview
- OSPF Feature Details
- OSPFv3 MIB Support
- Default OSPF Values
- Configuring OSPF Features (Web)
- OSPF Configuration
- OSPF Area Configuration
- OSPF Stub Area Summary
- OSPF Area Range Configuration
- OSPF Interface Statistics
- OSPF Interface Configuration
- OSPF Neighbor Table
- OSPF Neighbor Configuration
- OSPF Link State Database
- OSPF Virtual Link Configuration
- OSPF Virtual Link Summary
- OSPF Route Redistribution Configuration
- OSPF Route Redistribution Summary
- NSF OSPF Configuration
- Configuring OSPFv3 Features (Web)
- OSPFv3 Configuration
- OSPFv3 Area Configuration
- OSPFv3 Stub Area Summary
- OSPFv3 Area Range Configuration
- OSPFv3 Interface Configuration
- OSPFv3 Interface Statistics
- OSPFv3 Neighbors
- OSPFv3 Neighbor Table
- OSPFv3 Link State Database
- OSPFv3 Virtual Link Configuration
- OSPFv3 Virtual Link Summary
- OSPFv3 Route Redistribution Configuration
- OSPFv3 Route Redistribution Summary
- NSF OSPFv3 Configuration
- Configuring OSPF Features (CLI)
- Configuring OSPFv3 Features (CLI)
- OSPF Configuration Examples
- Configuring OSPF VRFs
- VRF
- RIP
- VRRP
- BGP
- Overview
- BGP Operations
- Decision Process Overview
- Path Attributes
- BGP Finite State Machine (FSM)
- Detecting Loss of Adjacency
- Authentication
- Outbound Update Groups
- Removing Private AS Numbers
- Templates
- Resolving Interface Routes
- Originating BGP Routes
- Equal Cost Multipath (ECMP)
- BGP Next-Hop Resolution
- Address Aggregation
- Routing Policy
- Inbound Policy
- Outbound Policy
- Routing Policy Changes
- BGP Timers
- Communities
- Routing Table Overflow
- Route Reflection
- VRF Support
- BGP Neighbor Configuration
- Extended Communities
- VPNv4/VRF Route Distribution via MP-BGP
- IPv6
- BGP Limitations
- BGP Configuration Examples
- Bidirectional Forwarding Detection
- Unicast Reverse Path Forwarding
- IPv6 Routing
- DHCPv6 Server Settings
- Differentiated Services
- Class-of-Service
- Auto VoIP
- IPv4 and IPv6 Multicast
- L3 Multicast Overview
- Default L3 Multicast Values
- Configuring General IPv4 Multicast Features (Web)
- Configuring IPv6 Multicast Features (Web)
- Configuring IGMP and IGMP Proxy (Web)
- Configuring MLD and MLD Proxy (Web)
- MLD Global Configuration
- MLD Routing Interface Configuration
- MLD Routing Interface Summary
- MLD Routing Interface Cache Information
- MLD Routing Interface Source List Information
- MLD Traffic
- MLD Proxy Configuration
- MLD Proxy Configuration Summary
- MLD Proxy Interface Membership Information
- Detailed MLD Proxy Interface Membership Information
- Configuring PIM for IPv4 and IPv6 (Web)
- Configuring DVMRP (Web)
- Configuring L3 Multicast Features (CLI)
- Configuring and Viewing IPv4 Multicast Information
- Configuring and Viewing IPv6 Multicast Route Information
- Configuring and Viewing IGMP
- Configuring and Viewing IGMP Proxy
- Configuring and Viewing MLD
- Configuring and Viewing MLD Proxy
- Configuring and Viewing PIM-DM for IPv4 Multicast Routing
- Configuring and Viewing PIM-DM for IPv6 Multicast Routing
- Configuring and Viewing PIM-SM for IPv4 Multicast Routing
- Configuring and Viewing PIM-SM for IPv6 Multicast Routing
- Configuring and Viewing DVMRP Information
- L3 Multicast Configuration Examples
- Multiple Registration Protocol
- OpenFlow
- Dell EMC Networking Python Support
- Appendix
- Index

634 Monitoring Switch Traffic
Viewing Statistics
Use the following commands in Privileged Exec mode to view statistics about
the traffic handled by the switch.
rmon collection history
index [owner
ownername] [buckets
bucket-number]
[interval seconds]
Enable an RMON MIB history statistics group on the
interface.
NOTE: You must configure RMON alarms and events before
RMON collection history is able to display.
• index — The requested statistics index group. (Range: 1–
65535)
• ownername — Records the RMON statistics group owner
name. If unspecified, the name is an empty string.
• bucket-number — A value associated with the number of
buckets specified for the RMON collection history group
of statistics. If unspecified, defaults to 50.
(Range: 1 - 65535)
• seconds — The number of seconds in each polling cycle.
If unspecified, defaults to 1800. (Range: 1–3600)
CTRL + Z Exit to Privileged Exec mode.
show rmon {alarms
|collection history |
events | history | log |
statistics}
View information collected by the RMON probe.
Command Purpose
show interfaces counters
[errors] [{interface |
port-channel}]
Display the error counters or number of octets and packets
handled by all interfaces or the specified interface.
show statistics
{switchport | interface}
Display detailed statistics for a specific port or LAG, or for
the entire switch. The interface variable includes the
interface type and number.
show interfaces
utilization [interface-id]
Display the TX and RX link utilization (frame rate and bits
per second).
Command Purpose