
Reference Guide
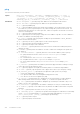
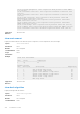
Table Of Contents
- OS10 Enterprise Edition User Guide Release 10.4.1.0
- Getting Started
- Supported Hardware
- Download OS10 image and license
- Installation using ONIE
- Log into OS10
- Install OS10 license
- Zero-touch deployment
- Remote access
- Upgrade OS10
- CLI Basics
- CLI command categories
- CONFIGURATION Mode
- Command help
- Check device status
- Candidate configuration
- Change to transaction-based configuration
- Copy running configuration
- Restore startup configuration
- Reload system image
- Filter show commands
- Alias command
- Batch mode
- Linux shell commands
- SSH commands
- OS9 environment commands
- Common commands
- alias
- alias (multi-line)
- batch
- boot
- commit
- configure
- copy
- default (alias)
- delete
- description (alias)
- dir
- discard
- do
- feature config-os9-style
- exit
- license
- line (alias)
- lock
- management route
- move
- no
- reload
- show alias
- show boot
- show candidate-configuration
- show environment
- show inventory
- show ip management-route
- show ipv6 management-route
- show license status
- show running-configuration
- show startup-configuration
- show system
- show version
- start
- system
- system identifier
- terminal
- traceroute
- unlock
- write
- Interfaces
- Ethernet interfaces
- Unified port groups
- L2 mode configuration
- L3 mode configuration
- Fibre Channel interfaces
- Management interface
- VLAN interfaces
- User-configured default VLAN
- VLAN scale profile
- Loopback interfaces
- Port-channel interfaces
- Configure interface ranges
- Switch-port profiles
- Configure breakout mode
- Breakout auto-configuration
- Forward error correction
- Energy-efficient Ethernet
- View interface configuration
- Interface commands
- channel-group
- default vlan-id
- description (Interface)
- duplex
- feature auto-breakout
- fec
- interface breakout
- interface ethernet
- interface loopback
- interface mgmt
- interface null
- interface port-channel
- interface range
- interface vlan
- link-bundle-utilization
- mode
- mode l3
- mtu
- port-group
- scale-profile vlan
- show discovered-expanders
- show interface
- show inventory media
- show link-bundle-utilization
- show port-channel summary
- show port-group
- show switch-operating-mode
- show switch-port-profile
- show unit-provision
- show vlan
- shutdown
- speed (Fibre Channel)
- speed (Management)
- switch-port-profile
- switchport access vlan
- switchport mode
- switchport trunk allowed vlan
- unit-provision
- Fibre Channel
- Layer 2
- 802.1X
- Link Aggregation Control Protocol
- Link Layer Discovery Protocol
- Optional TLVs
- Organizationally-specific TLVs
- Media endpoint discovery
- Network connectivity device
- LLDP-MED capabilities TLV
- Network policies TLVs
- Define network policies
- Packet timer values
- Disable and re-enable LLDP
- Disable and re-enable LLDP on management ports
- Advertise TLVs
- Network policy advertisement
- Fast start repeat count
- View LLDP configuration
- Adjacent agent advertisements
- Time to live
- LLDP commands
- clear lldp counters
- clear lldp table
- lldp enable
- lldp holdtime-multiplier
- lldp med fast-start-repeat-count
- lldp med
- lldp med network-policy
- lldp med network-policy (Interface)
- lldp med tlv-select
- lldp receive
- lldp reinit
- lldp timer
- lldp tlv-select basic-tlv
- lldp tlv-select dot1tlv
- lldp tlv-select dot3tlv
- lldp transmit
- show lldp interface
- show lldp errors
- show lldp med
- show lldp neighbors
- show lldp timers
- show lldp tlv-select interface
- show lldp traffic
- show nework-policy profile
- Media Access Control
- Multiple Spanning-Tree Protocol
- Configure MSTP
- Create instances
- Root selection
- Non-Dell hardware
- Region name or revision
- Modify parameters
- Interface parameters
- Forward traffic
- Spanning-tree extensions
- MST commands
- instance
- name
- revision
- spanning-tree bpdufilter
- spanning-tree bpduguard
- spanning-tree disable
- spanning-tree guard
- spanning-tree mode
- spanning-tree mst
- spanning-tree msti
- spanning-tree mst configuration
- spanning-tree mst disable
- spanning-tree mst force-version
- spanning-tree mst forward-time
- spanning-tree mst hello-time
- spanning-tree mst mac-flush-threshold
- spanning-tree mst max-age
- spanning-tree mst max-hops
- spanning-tree port
- show spanning-tree mst
- show spanning-tree msti
- Rapid per-VLAN spanning-tree plus
- Load balance and root selection
- Enable RPVST+
- Select root bridge
- Root assignment
- Loop guard
- Global parameters
- RPVST+ commands
- clear spanning-tree counters
- clear spanning-tree detected-protocol
- show spanning-tree vlan
- spanning-tree bpdufilter
- spanning-tree bpduguard
- spanning-tree disable
- spanning-tree guard
- spanning-tree mode
- spanning-tree port
- spanning-tree vlan cost
- spanning-tree vlan disable
- spanning-tree vlan forward-time
- spanning-tree vlan force-version
- spanning-tree vlan hello-time
- spanning-tree vlan mac-flush-threshold
- spanning-tree vlan max-age
- spanning-tree vlan priority
- spanning-tree vlan priority (Interface)
- spanning-tree vlan root
- Rapid Spanning-Tree Protocol
- Enable globally
- Global parameters
- Interface parameters
- Root bridge selection
- EdgePort forward traffic
- Spanning-tree extensions
- RSTP commands
- clear spanning-tree counters
- show spanning-tree active
- show spanning-tree interface
- spanning-tree bpdufilter
- spanning-tree bpduguard
- spanning-tree disable
- spanning-tree guard
- spanning-tree mode
- spanning-tree port
- spanning-tree rstp force-version
- spanning-tree rstp forward-time
- spanning-tree rstp hello-time
- spanning-tree rstp mac-flush-threshold
- spanning-tree rstp max-age
- spanning-tree rstp
- Virtual LANs
- Port monitoring
- Layer 3
- Virtual routing and forwarding
- Configure management VRF
- Configure non-default VRF instances
- Sample VRF configuration
- View VRF instance information
- VRF commands
- Bidirectional Forwarding Detection
- Border Gateway Protocol
- Sessions and peers
- Route reflectors
- Multiprotocol BGP
- Attributes
- Selection criteria
- Weight and local preference
- Multiexit discriminators
- Origin
- AS path and next-hop
- Best path selection
- More path support
- Advertise cost
- 4-Byte AS numbers
- AS number migration
- Configure Border Gateway Protocol
- Enable BGP
- Configure Dual Stack
- Peer templates
- Neighbor fall-over
- Configure password
- Fast external fallover
- Passive peering
- Local AS
- AS number limit
- Redistribute routes
- Additional paths
- MED attributes
- Local preference attribute
- Weight attribute
- Enable multipath
- Route-map filters
- Route reflector clusters
- Aggregate routes
- Confederations
- Route dampening
- Timers
- Neighbor soft-reconfiguration
- BGP commands
- activate
- add-path
- address-family
- advertisement-interval
- advertisement-start
- aggregate-address
- allowas-in
- always-compare-med
- as-notation
- bestpath as-path
- bestpath med
- bestpath router-id
- clear ip bgp
- clear ip bgp *
- clear ip bgp dampening
- clear ip bgp flap-statistics
- connection-retry-timer
- confederation
- client-to-client
- cluster-id
- bgp dampening
- description
- default-metric
- default-originate
- distribute-list
- bgp default local-preference
- ebgp-multihop
- enforce-first-as
- fall-over
- fast-external-fallover
- inherit template
- listen
- local-as
- log-neighbor-changes
- maximum-paths
- maximum-prefix
- neighbor
- next-hop-self
- non-deterministic-med
- outbound-optimization
- password
- redistribute
- remote-as
- remove-private-as
- route-map
- route-reflector-client
- router bgp
- router-id
- send-community
- sender-side-loop-detection
- show ip bgp
- show ip bgp dampened-paths
- show ip bgp flap-statistics
- show ip bgp ipv4 unicast
- show ip bgp ipv6 unicast
- show ip bgp neighbors
- show ip bgp peer-group
- show ip bgp summary
- soft-reconfiguration inbound
- template
- timers
- vrf
- weight
- Equal cost multi-path
- IPv4 routing
- IPv6 routing
- Enable or disable IPv6
- IPv6 addresses
- Stateless autoconfiguration
- Neighbor Discovery
- Duplicate address discovery
- Static IPv6 routing
- IPv6 destination unreachable
- IPv6 hop-by-hop options
- View IPv6 information
- IPv6 commands
- clear ipv6 neighbors
- clear ipv6 route
- ipv6 address
- ipv6 address autoconfig
- ipv6 address dhcp
- ipv6 enable
- ipv6 address eui-64
- ipv6 address link-local
- ipv6 hop-by-hop
- ipv6 nd dad
- ipv6 nd hop-limit
- ipv6 nd managed-config-flag
- ipv6 nd max-ra-interval
- ipv6 nd mtu
- ipv6 nd other-config-flag
- ipv6 nd prefix
- ipv6 nd ra-lifetime
- ipv6 nd reachable-time
- ipv6 nd retrans-timer
- ipv6 nd send-ra
- ipv6 route
- ipv6 unreachables
- show ipv6 neighbors
- show ipv6 route
- show ipv6 interface brief
- Internet Group Management Protocol
- IGMP snooping
- IGMP snooping commands
- ip igmp snooping
- ip igmp snooping enable
- ip igmp snooping fast-leave
- ip igmp snooping last-member-query-interval
- ip igmp snooping mrouter
- ip igmp snooping querier
- ip igmp snooping query-interval
- ip igmp query-max-resp-time
- ip igmp version
- show ip igmp snooping groups
- show ip igmp snooping groups detail
- show ip igmp snooping interface
- show ip igmp snooping mrouter
- Multicast Listener Discovery Protocol
- MLD snooping
- MLD snooping commands
- ipv6 mld snooping
- ipv6 mld snooping enable
- ipv6 mld snooping fast-leave
- ipv6 mld snooping last-member-query-interval
- ipv6 mld snooping mrouter
- ipv6 mld snooping querier
- ipv6 mld snooping query-interval
- ipv6 mld query-max-resp-time
- ipv6 mld version
- show ipv6 mld snooping groups
- show ipv6 mld snooping groups detail
- show ipv6 mld snooping interface
- show ipv6 mld snooping mrouter
- Open shortest path first
- Autonomous system areas
- Areas, networks, and neighbors
- Router types
- Designated and backup designated routers
- Link-state advertisements
- Router priority
- Shortest path first throttling
- OSPFv2
- Enable OSPFv2
- Assign router identifier
- Stub areas
- Passive interfaces
- Fast convergence
- Interface parameters
- Redistribute routes
- Default route
- Summary address
- Graceful restart
- OSPFv2 authentication
- Troubleshoot OSPFv2
- OSPFv2 commands
- area default-cost
- area nssa
- area range
- area stub
- auto-cost reference-bandwidth
- clear ip ospf process
- clear ip ospf statistics
- default-information originate
- default-metric
- fast-converge
- graceful-restart
- ip ospf area
- ip ospf authentication-key
- ip ospf cost
- ip ospf dead-interval
- ip ospf hello-interval
- ip ospf message-digest-key
- ip ospf mtu-ignore
- ip ospf network
- ip ospf passive
- ip ospf priority
- ip ospf retransmit-interval
- ip ospf transmit-delay
- log-adjacency-changes
- max-metric router-lsa
- maximum-paths
- redistribute
- router-id
- router ospf
- show ip ospf
- show ip ospf asbr
- show ip ospf database
- show ip ospf database asbr-summary
- show ip ospf database external
- show ip ospf database network
- show ip ospf database nssa external
- show ip ospf database opaque-area
- show ip ospf database opaque-as
- show ip ospf database opaque-link
- show ip ospf database router
- show ip ospf database summary
- show ip ospf interface
- show ip ospf routes
- show ip ospf statistics
- show ip ospf topology
- summary-address
- timers lsa arrival
- timers spf
- timers throttle lsa all
- OSPFv3
- Enable OSPFv3
- Assign Router ID
- Configure Stub Areas
- Enable Passive Interfaces
- Interface OSPFv3 Parameters
- Default route
- OSPFv3 IPsec authentication and encryption
- Troubleshoot OSPFv3
- OSPFv3 Commands
- area authentication
- area encryption
- area stub
- auto-cost reference-bandwidth
- clear ipv6 ospf process
- clear ipv6 ospf statistics
- default-information originate
- ipv6 ospf area
- ipv6 ospf authentication
- ipv6 ospf cost
- ipv6 ospf dead-interval
- ipv6 ospf encryption
- ipv6 ospf hello-interval
- ipv6 ospf network
- ipv6 ospf passive
- ipv6 ospf priority
- log-adjacency-changes
- maximum-paths
- redistribute
- router-id
- router ospfv3
- show ipv6 ospf
- show ipv6 ospf database
- show ipv6 ospf interface
- show ipv6 ospf neighbor
- show ipv6 ospf statistics
- timers spf (OSPFv3)
- Object tracking manager
- Policy-based routing
- Virtual Router Redundancy Protocol
- Virtual routing and forwarding
- UFT modes
- System management
- Dynamic Host Configuration Protocol
- Network Time Protocol
- System clock
- System banners
- User session management
- Telnet server
- Security
- User re-authentication
- Password strength
- Role-based access control
- Assign user role
- RADIUS authentication
- TACACS+ authentication
- TACACS+ unknown or missing user role
- SSH server
- Virtual terminal line
- Enable AAA accounting
- Enable user lockout
- Limit concurrent login sessions
- Enable login statistics
- Security commands
- aaa accounting
- aaa authentication login
- aaa re-authenticate enable
- crypto ssh-key generate
- ip access-class
- ipv6 access-class
- ip ssh server challenge-response-authentication
- ip ssh server cipher
- ip ssh server enable
- ip ssh server hostbased-authentication
- ip ssh server kex
- ip ssh server mac
- ip ssh server password-authentication
- ip ssh server port
- ip ssh server pubkey-authentication
- ip ssh server vrf
- line vty
- login concurrent-session limit
- login-statistics enable
- password-attributes
- password-attributes max-retry lockout-period
- radius-server host
- radius-server retransmit
- radius-server timeout
- radius-server vrf
- show crypto ssh-key
- show ip ssh
- show login-statistics
- show users
- tacacs-server host
- tacacs-server timeout
- username password role
- username sshkey
- username sshkey filename
- userrole default inherit
- Simple Network Management Protocol
- Uplink Failure Detection
- OS10 image upgrade
- OpenFlow
- OpenFlow logical switch instance
- OpenFlow controller
- OpenFlow version 1.3
- Ports
- Flow table
- Group table
- Meter table
- Instructions
- Action set
- Action types
- Counters
- OpenFlow protocol
- Connection setup TCP
- Supported controllers
- Flow table modification messages
- Message types
- Flow match fields
- Action structures
- Capabilities supported by the data path
- Multipart message types
- Switch description
- Property type
- Group configuration
- Controller roles
- Packet-in reasons
- Flow-removed reasons
- Error types from switch to controller
- OpenFlow use cases
- Configure OpenFlow
- OpenFlow commands
- OpenFlow-only mode commands
- Access Control Lists
- IP ACLs
- MAC ACLs
- Control-plane ACLs
- IP fragment handling
- L3 ACL rules
- Assign sequence number to filter
- L2 and L3 ACLs
- Assign and apply ACL filters
- Ingress ACL filters
- Egress ACL filters
- Clear access-list counters
- IP prefix-lists
- Route-maps
- Match routes
- Set conditions
- continue Clause
- ACL flow-based monitoring
- Enable flow-based monitoring
- ACL commands
- clear ip access-list counters
- clear ipv6 access-list counters
- clear mac access-list counters
- deny
- deny (IPv6)
- deny (MAC)
- deny icmp
- deny icmp (IPv6)
- deny ip
- deny ipv6
- deny tcp
- deny tcp (IPv6)
- deny udp
- deny udp (IPv6)
- description
- ip access-group
- ip access-list
- ip as-path access-list
- ip community-list standard deny
- ip community–list standard permit
- ip extcommunity-list standard deny
- ip extcommunity-list standard permit
- ip prefix-list description
- ip prefix-list deny
- ip prefix-list permit
- ip prefix-list seq deny
- ip prefix-list seq permit
- ipv6 access-group
- ipv6 access-list
- ipv6 prefix-list deny
- ipv6 prefix-list description
- ipv6 prefix-list permit
- ipv6 prefix-list seq deny
- ipv6 prefix-list seq permit
- mac access-group
- mac access-list
- permit
- permit (IPv6)
- permit (MAC)
- permit icmp
- permit icmp (IPv6)
- permit ip
- permit ipv6
- permit tcp
- permit tcp (IPv6)
- permit udp
- permit udp (IPv6)
- remark
- seq deny
- seq deny (IPv6)
- seq deny (MAC)
- seq deny icmp
- seq deny icmp (IPv6)
- seq deny ip
- seq deny ipv6
- seq deny tcp
- seq deny tcp (IPv6)
- seq deny udp
- seq deny udp (IPv6)
- seq permit
- seq permit (IPv6)
- seq permit (MAC)
- seq permit icmp
- seq permit icmp (IPv6)
- seq permit ip
- seq permit ipv6
- seq permit tcp
- seq permit tcp (IPv6)
- seq permit udp
- seq permit udp (IPv6)
- show access-group
- show access-lists
- show ip as-path-access-list
- show ip community-list
- show ip extcommunity-list
- show ip prefix-list
- Route-map commands
- continue
- match as-path
- match community
- match extcommunity
- match interface
- match ip address
- match ip next-hop
- match ipv6 address
- match ipv6 next-hop
- match metric
- match origin
- match route-type
- match tag
- route-map
- set comm-list add
- set comm-list delete
- set community
- set extcomm-list add
- set extcomm-list delete
- set extcommunity
- set local-preference
- set metric
- set metric-type
- set next-hop
- set origin
- set tag
- set weight
- show route-map
- Quality of service
- Configure quality of service
- Ingress traffic classification
- Egress traffic classification
- Policing traffic
- Mark Traffic
- Color traffic
- Modify packet fields
- Shaping traffic
- Bandwidth allocation
- Strict priority queuing
- Buffer management
- Congestion avoidance
- Storm control
- RoCE for faster access and lossless connectivity
- QoS commands
- bandwidth
- class
- class-map
- clear interface
- clear qos statistics
- clear qos statistics type
- control-plane
- flowcontrol
- match
- match cos
- match dscp
- match precedence
- match queue
- match vlan
- mtu
- pause
- pfc-cos
- pfc-max-buffer-size
- pfc-shared-buffer-size
- pfc-shared-headroom-buffer-size
- police
- policy-map
- priority
- priority-flow-control mode
- qos-group dot1p
- qos-group dscp
- queue-limit
- queue bandwidth
- queue qos-group
- random-detect (interface)
- random-detect (queue)
- random-detect color
- random-detect ecn
- random-detect ecn
- random-detect pool
- random-detect weight
- service-policy
- set cos
- set dscp
- set qos-group
- shape
- show class-map
- show control-plane info
- show control-plane statistics
- show interface priority-flow-control
- show qos interface
- show policy-map
- show qos control-plane
- show qos egress bufffers interface
- show egress buffer-stats interface
- show qos ingress buffers interface
- show ingress buffer-stats interface
- show queuing statistics
- show qos system
- show qos system buffers
- show qos maps
- show qos wred-profile
- system qos
- trust-map
- trust dot1p-map
- trust dscp-map
- qos-map traffic-class
- trust-map
- wred
- Virtual Link Trunking
- Converged data center services
- sFlow
- RESTCONF API
- Troubleshoot OS10
- Diagnostic tools
- Password recovery
- Restore factory defaults
- SupportAssist
- Support bundle
- System monitoring
- Log into OS10 device
- Frequently asked questions
- Support resources

PID USER PR NI VIRT RES SHR S %CPU %MEM TIME+
COMMAND
9 root 20 0 0 0 0 S 6.1 0.0 5:22.41
rcuos/1
819 snmp 20 0 52736 6696 4132 S 6.1 0.2 2:44.18 snmpd
30452 admin 20 0 22076 2524 2100 R 6.1 0.1 0:00.02 top
1 root 20 0 112100 5840 3032 S 0.0 0.1 0:12.32
systemd
2 root 20 0 0 0 0 S 0.0 0.0 0:00.00
kthreadd
3 root 20 0 0 0 0 S 0.0 0.0 0:25.37
ksoftirqd/0
5 root 0 -20 0 0 0 S 0.0 0.0 0:00.00
kworker/0:+
7 root 20 0 0 0 0 R 0.0 0.0 5:15.27
rcu_sched
8 root 20 0 0 0 0 S 0.0 0.0 2:43.64
rcuos/0
10 root 20 0 0 0 0 S 0.0 0.0 0:00.00
rcu_bh
11 root 20 0 0 0 0 S 0.0 0.0 0:00.00
rcuob/0
12 root 20 0 0 0 0 S 0.0 0.0 0:00.00
rcuob/1
13 root rt 0 0 0 0 S 0.0 0.0 0:07.30
migration/0
14 root rt 0 0 0 0 S 0.0 0.0 0:02.18
watchdog/0
15 root rt 0 0 0 0 S 0.0 0.0 0:02.12
watchdog/1
16 root rt 0 0 0 0 S 0.0 0.0 0:04.98
migration/1
17 root 20 0 0 0 0 S 0.0 0.0 0:03.92
ksoftirqd/1
19 root 0 -20 0 0 0 S 0.0 0.0 0:00.00
kworker/1:+
20 root 0 -20 0 0 0 S 0.0 0.0 0:00.00
khelper
21 root 20 0 0 0 0 S 0.0 0.0 0:00.00
kdevtmpfs
22 root 0 -20 0 0 0 S 0.0 0.0 0:00.00 netns
23 root 20 0 0 0 0 S 0.0 0.0 0:00.41
khungtaskd
24 root 0 -20 0 0 0 S 0.0 0.0 0:00.00
writeback
25 root 25 5 0 0 0 S 0.0 0.0 0:00.00 ksmd
--more--
OS10# show processes node-id 1 pid 1019
top - 09:21:58 up 5 days, 8 min, 2 users, load average: 0.18, 0.30,
0.31
Tasks: 1 total, 0 running, 1 sleeping, 0 stopped, 0 zombie
%Cpu(s): 9.7 us, 3.9 sy, 0.3 ni, 85.8 id, 0.0 wa, 0.0 hi, 0.3 si,
0.0 st
KiB Mem: 3998588 total, 2089040 used, 1909548 free, 143772 buffers
KiB Swap: 399856 total, 0 used, 399856 free. 483276 cached
Mem
PID USER PR NI VIRT RES SHR S %CPU %MEM TIME+
COMMAND
1019 root 20 0 1829416 256080 73508 S 6.6 6.4 1212:36
base_nas
OS10#
Supported
Releases
10.3.0E or later
780 Troubleshoot OS10