
Administrator Guide


• Storage Front End Port Read IO/Sec (24h)
• Storage Front End Port Write Latency IO/Sec (24h)
• Storage Front End Port Read Latency (24h)
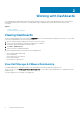
The following figure shows an example of a Dell Storage Port Top-N Reports dashboard.
Figure 8. Sample Dell Storage Port Top-N Reports Dashboard
View Graph of Metric
Click a row on any widget to view a graph of the metric.
Modify Period Length
The length of time is configurable by editing the widget and selecting a new time value.
1. Click Edit Widget.
The Edit Top‐N Analysis Widget dialog box appears.
2. Select the new time period from the Period Length drop‐down menu.
3. Click OK.
Alternatively, to analyze the top volumes for different durations, clone the dashboard and then adjust the Period Length for each
widget on the new dashboard.
Modifying Dashboards and Widgets
See the VMware vRealize Operations Manager documentation for detailed information on working with dashboards and widgets:
https://www.vmware.com/support/pubs/vrealize-operations-manager-pubs.html
12
Working with Dashboards