Dell Storage vRealize Operations Management Pack Version 1.3 Administrator’s Guide Part Number: 680-109-003 December 2020 Rev.
Notes, Cautions, and Warnings NOTE: A NOTE indicates important information that helps you make better use of your product. CAUTION: A CAUTION indicates either potential damage to hardware or loss of data and tells you how to avoid the problem. WARNING: A WARNING indicates a potential for property damage, personal injury, or death. © 2019 – 2020 Dell Inc. or its subsidiaries. All rights reserved. Dell, EMC, and other trademarks are trademarks of Dell Inc. or its subsidiaries.
About This Guide This document provides the purpose and audience of the Dell Storage vRealize Operations Management Pack Administrator’s Guide and a list of related publications.
Contents About This Guide....................................................................................................................................................................... 3 Chapter 1: Getting Started............................................................................................................ 5 Introduction........................................................................................................................................................................
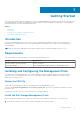
1 Getting Started The Dell Storage vRealize Operations Management Pack is an embedded adapter that gathers topology, metrics, and alerts from Dell Storage Manager for display on dashboards in VMware vRealize Operations Manager. This guide refers to the embedded management pack as the Dell Storage Management Pack.
https://IP Replace IP with the fully-qualified domain name (FQDN) or IP address of the vRealize Operations Manager. 2. When prompted, type the Administrator user name and password. The vRealize Operations Manager user interface opens. 3. Add a solution: ● For vROPS version 7.5: In the left pane of vRealize Operations Manager, click Administration > Solutions > Repository. ● For earlier versions of vROPS: In the left pane of vRealize Operations Manager, click Administration > Solutions 4.
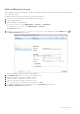
Add an Adapter Instance Add an adapter instance by providing the hostname or IP address of the Data Collector and the login credentials of an Admin user on the Data Collector. An adapter instance is required for each Data Collector being monitored. 1. In a browser, open the vRealize Operations Manager user interface. 2. Log in as an administrator. 3. Open the Manage Solution dialog box: ● For vROPS version 7.5: Click Administration > Solutions > Configuration.
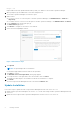
Figure 3. Manage Credential Dialog Box 11. Specify login credentials for both the Admin user on the Data Collector and the vROPs appliance: a. User Name/Password — enter the login credentials of an Admin user on the Data Collector. b. vROPS User Name/Password — enter the login credentials of the vROPs appliance. 12. Click OK. 13. Click Test Connection to validate that the settings are correct. 14. (Optional) Expand Advanced Settings and select a different Data Collector from the list. 15.
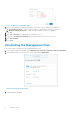
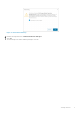
Figure 5. Uninstallation Warning 4. Read the message and select I understand the risk and agree. 5. Click OK. The uninstall process finishes and the package is removed.
2 Working with Dashboards Several dashboards are prepackaged with the Dell Storage Management Pack. The Dell Storage dashboards provide a starting point for monitoring and analyzing your environment. The dashboards are fully configurable and can be modified to better represent your environment. Topics: • • Viewing Dashboards Modifying Dashboards and Widgets Viewing Dashboards The Dell Storage dashboards are accessed from the Dashboards menu of the vRealize Operations Manager user interface.
Figure 6. Sample Dell Storage & VMware Relationship Dashboard View Dell Storage Metrics This dashboard displays the health status and metrics for the selected Storage Center. 1. Select a resource for the Storage Center from the Select Resource to View Metrics widget. 2. Select a metric to graph for the resource from the Select Metrics to Graph widget. 3. Select the graph type from the Metric Graph widget. The following figure shows an example of a Dell Storage Metrics dashboard.
Figure 7. Sample Dell Storage Metrics Dashboard View Dell Storage Volume Top-N Reports This dashboard lists the top 25 volumes for the following categories: ● ● ● ● ● ● Dell Dell Dell Dell Dell Dell Storage Storage Storage Storage Storage Storage Volume Volume Volume Volume Volume Volume Total IO/sec (24h) Total KB/sec (24h) Read IO/sec (24h) Write IO/sec (24h) Replay Space Capacity The following figure shows an example of a Dell Storage Volume Top-N Reports dashboard. Figure 8.
View Graph of Metric Click a row on any widget to view a graph of the metric. Modify Period Length Except for the Replay Space and Volume Capacity widgets, each widget lists the top 25 volumes for the last 24-hour period. Edit the widget to adjust the duration. 1. Click Edit Widget. The Edit Top‐N Analysis Widget dialog box appears. 2. Select the new time period from the Period Length drop‐down menu. 3. Click OK.
● ● ● ● ● Storage Storage Storage Storage Storage Front Front Front Front Front End End End End End Total kb/Sec (24h) Port Write IO/Sec (24h) Port Read IO/Sec (24h) Port Write Latency IO/Sec (24h) Port Read Latency (24h) The following figure shows an example of a Dell Storage Port Top-N Reports dashboard. Figure 10. Sample Dell Storage Port Top-N Reports Dashboard View Graph of Metric Click a row on any widget to view a graph of the metric.