
White Papers


35 Sizing and Best Practices for Online Transaction Processing Applications with Oracle 11g R2 using Dell PS Series | BP1003
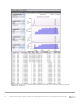
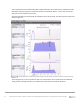
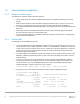
As seen in the SAN HQ chart in Figure 14, I/O activity was observed on both the SSD and 10K SAS drives. A
peak IOPS of 19,000 was observed compared to almost 27,000 as described in section 6.2.1 (1 TB array
capacity utilization).
The total capacity utilization on the array was about 4 TB, so the data was spread across both the SSD and
10K SAS drives. The SSDs had to wait for the I/O to complete on 10K SAS drives, and as a result the
average IOPS produced from individual SSDs dropped from 3,600 to 1,800 in this scenario.
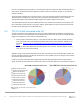
The 19,000 IOPS represent the more realistic performance in customer environments, because most of the
time at least 50% to 60% capacity of the array is utilized, which will force the data to be spread across both
the SSD and 10K SAS drives on a PS6110XS array.
6.3 TPC-E I/O with increased write I/O
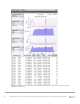
The I/O characteristics were studied when running the TPC-E workload with two database configurations in
sections 6.2.1 and 6.2.2. Almost 100% read I/O was observed in both cases as shown in the SAN HQ charts
(Figure 13 and Figure 14). The reasons for this behavior are:
TPC-E is more read intensive with a 9.7:1 I/O read-to-write ratio, while TPC-C typically represents
1.9:1 read-to-write ratio. More detailed information about TPC-E characteristics is available in the
document, TPC-E vs. TPC-C: Characterizing the New TPC-E Benchmark via an I/O Comparison
Study.
48 GB of memory was allocated to the Oracle process on each node. This also helped in caching
much of the I/O at the server memory.
Typically, storage arrays perform well with read I/O. Also, the memory on the server will help by caching the
read I/O and helps to improve overall read performance. A more realistic test for any storage system is when
we introduce write I/O transactions.
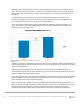
In this test, the write transactions were significantly increased using Quest Benchmark Factory software.
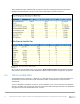
Figure 15 shows the write-intensive transaction mix used to run this test compared to the default transactions.
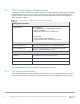
Quest BMF transaction mixes
Quest BMF: Default transaction mix
Quest BMF: Write-intensive transaction mix
Broker-volume transaction
Customer-position transaction
Market-feed transaction
Market-watch transaction
Security-detail transaction
Trade-lookup transaction
Trade-order transaction
Trade-result transaction
Trade-status transaction
Trade-update transaction