Dell EqualLogic Best Practices Series Microsoft SQL Server 2008 Backup and Restore using Dell EqualLogic A Dell Technical Whitepaper This document has been archived and will no longer be maintained or updated. For more information go to the Storage Solutions Technical Documents page on Dell TechCenter or contact support.
THIS WHITE PAPER IS FOR INFORMATIONAL PURPOSES ONLY, AND MAY CONTAIN TYPOGRAPHICAL ERRORS AND TECHNICAL INACCURACIES. THE CONTENT IS PROVIDED AS IS, WITHOUT EXPRESS OR IMPLIED WARRANTIES OF ANY KIND. © 2012 Dell Inc. All rights reserved. Reproduction of this material in any manner whatsoever without the express written permission of Dell Inc. is strictly forbidden. For more information, contact Dell.
Table of Contents 1 Introduction ....................................................................................................................................................... 3 1.1 Audience ..................................................................................................................................................... 3 2 Considerations for selecting a data backup solution .................................................................................
Acknowledgements This whitepaper was produced by the PG Storage Infrastructure and Solutions of Dell Inc.
Executive Summary ® ® Creating an optimized Microsoft SQL Server database backup is the foundation for every DBA’s data protection plan. This paper studies the impact on SQL Server host during backup and provides best practices and reference architecture for backup and restores operations. The tests were performed on virtualized Microsoft SQL Server 2008 R2 Databases running on Dell™ EqualLogic™ SAN.
1 Introduction SQL Server databases form the backbone for many businesses, housing data for critical applications. Because access to this data is critical for day to day business operations, Service Level Agreements (SLAs) demand that databases remain online and available—there is little tolerance for downtime. Database protection and disaster recovery are among the top concerns for database administrators. Many types of failure scenarios can impact SQL server database application availability.
2 Considerations for selecting a data backup solution Business environments differ widely, from small businesses running just a few servers to large data centers managing complex server and storage architectures. Each organization must choose a data protection solution that fits its unique business environment.
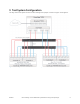
3 Test System Configuration The SQL Server test system used to conduct testing for this paper is shown in Figure 1 and Figure 2.
Figure 2 High level view of test system components Key design details in the test system configuration include: • • Installed and configured SQL Server 2008 R2 Enterprise Edition in a Windows Server 2008 R2 Enterprise Edition virtual machine (SQL DB VM) hosted on the VMware vSphere ESXi4.1 server on a Dell PowerEdge R710 server. The virtual machine that hosted the SQL Server was configured to use eight virtual CPUs and 16GB of reserved memory.
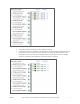
Figure 3 vSwitch0 configuration o o A separate vSwitch (vSwitch1) for iSCSI SAN connectivity. Created virtual network adapters (type VMXNET 3) within the VM and assigned them to the vSwitch1 (refer to Figure 4) on the vSphere host. Used EQL MPIO DSM via Host Integration Tools (HIT) Kit to setup multiple paths from the guest VM to the storage volumes. These paths are labeled as “Guest iSCSI Path” in Figure 2.
• • • • • • • • BP1021 The two local disks installed in the R710 server were configured as a RAID 1 set. ESXi 4.1 was installed on these disks, and the guest virtual machine OS disk partitions were also hosted within the virtual machine file system on these disks. ™ A second VMware ESXi 4.1 server (INFRA) was used to host virtual machines for vCenter and Active Directory. A third VMware ESXi 4.
4 Test studies To support development of this paper, a full-scale virtualized Microsoft SQL server configuration running within a VMware vSphere v4.1 virtual machine environment was deployed and tested. 4.
4.1.1 Baseline Test #1: Impact of multiple backup target files on backup throughput Baseline test #1, studies the behavior of increasing the backup process speed by creating multiple writer threads via configuring multiple target files within a single target volume. SQL server uses one backup writer thread per target backup file configured.
The read/write I/O throughput is the main performance measure which impacts database backup duration. The database backup is mostly a sequential operation with a block size of approximately 256KB or larger. The configuration with five backup files in a single volume (Baseline Test 1(c)) as shown in baseline test#1, (refer to Figure 5), was able to achieve maximum throughput compared to configurations with fewer backup files in a single volume.
4.1.2 Baseline Test #2: Impact of multiple target volumes/files on backup throughput Baseline test #2, studies the impact of increasing storage volumes for hosting the backup target files. As described in figure 7, three scenarios with one to three backup target volumes were simulated with two backup files per volume.
Figure 8 illustrates the write I/O throughput achieved in each of the configurations shown in baseline test#2 (refer to Figure 7). Note the highlighted data with maximum throughput of 307MB/sec for the configuration with two backup files each in three backup volumes. Figure 8 Throughput of multiple target volumes with 2 backup files each Using three volumes hosting a total of six target files proved to be an efficient use of storage and provided the maximum throughput.
Figure 9 Backup/restore times in both the configurations Figure 10 Backup read/write Throughput comparisons Writing to multiple files across different disk volumes provides better data backup rates and reduced backup windows as shown in the tests above. Specifically, for our storage configuration, three target volumes with two backup target files each yielded the best throughput. All our following tests would use this configuration (i.e.
4.2 Impact of backup and restore processes on SQL host using native SQL server tool The goal of this test scenario was to study the performance impact on the production server when running the SQL server native backup utility. This is done by simulating database backup and restore scenarios across the SAN fabric to and from the volumes hosted on a second storage array.
Test details: • Total database size at the full backup point: ~1TB • Database workload: During the test timeline Quest Benchmark Factory was used to simulate an OLTP style workload. A constant 500 user workload was simulated, generating an average I/O load of 25 transactions per second (tps) against the database. • We simulated three types of backup scenarios, gathered the results, and analyzed each case. We used the SQL server Management Studio to perform the following: o o o 4.2.
Impact of full backup & verify Figure 13 shows an increase in CPU utilization at the SQL production server during full backup and verify. The average CPU utilization percentage increased from 1.7% to 13% during backup and 1.7% to 10% during verify. As expected, we saw a significant increase in CPU load on the system during the time that the backup utility was creating the backup.
Figure 15 shows the IO operations at the storage arrays, recorded using SANHQ. It shows the IOPS before full backup and during full backup. The user transactions have been running throughout before, during and after full backup. As expected the IOPS increased during full backup due to extra read write operations involved during backup process plus IO operations from the user transactions. The figure shows the combined IOPS at both data and backup pools.
Impact of transaction logs backup Figure 17 illustrates the increase in CPU utilization during every transaction log backup. This increase appears as a spike in utilization for each of the transaction log backups. The impact to application and disk response times were minimal compared to the impact during full backup and are not shown.
Restore time and throughput The total time required to complete full database and transactional log restore were measured along with throughput during each operation. Table 3 shows the restore operations performed and their descriptions.
Figure 20 Restore throughput comparisons BP1021 Microsoft SQL Server 2008 Backup and Restore using Dell EqualLogic 21
4.2.2 Test #2: Performance impact studies during full, tlog, and differential backups This test simulates an environment with weekly full backups, daily differential backups, and transaction log backups for every 30 minutes assuming the typical production duration to be eight hour workday. • • • To simulate this test, we ran the user load from Benchmark Factory for ten hours, scheduled a o Full backup after an hour of user load run.
CPU Utilization Figure 22 shows increase in CPU utilization during full, tlog, and differential backups. The average CPU utilization percentage increased from 1.7% to 13% during full backup, 1.7% to 10% during verify, and 1.7% to 5% during differential backup. As expected, we saw a significant increase in CPU load on the system during the time of full backup compared to tlog and differential backups.
Figure 24 shows the IO operations at the storage arrays, recorded using SANHQ. It shows the IOPS before full backup and during full and differential backups. The user transactions have been running throughout; before, during and after backup. As expected the IOPS increased during full and differential backups due to extra read write operations involved during backup process plus IO operations from the user transactions. The figure shows the combined IOPS at both data and backup pools.
Disk Latency Figure 25 shows the increase in disk read latency (measured using Perfmon on the SQL Server host) from the EqualLogic array that is part of the data pool during full backup and verify period. The impact on disk read latency was high during full backup compared to during tlog and differential backups because the entire data set backup was taken while the user transactions were running on the same database.
The “Baseline-Full Restore” in Figure 26 is from the baseline test configuration 2(c) from Figure 7. Figure 26 compares the restore times of baseline and Test Case#2 (Full, Tlog, and Differential Backup). For this test (Test Case#2), it was assumed to restore the data to a specific day in a week and hence the last full backup was restored followed by only the differential backup restore of the specific day (no Tlogs were restored).
4.2.3 Test #3: SQL Server performance impact studies during Compression SQL compression, if enabled could improve backup storage requirements, however could also impact the resource utilization on the host. With the tests described in this section, the impact of enabling SQL compression on both resource utilization and backup throughput were measured. For this test the below steps were followed.
Figure 29 Backup duration comparison Figure 30 compares the reduction in the backup file size after enabling compression. It also shows the increase in the CPU utilization on the SQL server both during backup and restore. Figure 30 Effects of Compression on Backup and Restore Note: By default, backup compression significantly increases CPU usage, and the additional CPU consumed by the compression process might adversely impact concurrent operations.
4.2.4 Analysis and Conclusion As expected, we saw a significant increase in CPU utilization, application response times and disk response times during full backup as compared to transaction log and differential backups. Based on the test results it is evident that running backups during peak periods will have direct impact on: • • The SQL Server host performance: backup processing CPU cycles may impact other application workloads. Database performance: increased query response times.
5 Best Practice Recommendations 5.1 Network Infrastructure The following are network infrastructure design best practices: • • • • • Design redundant SAN component architectures. This includes the NICs on the servers and switches for the storage network (including server blade chassis switches and external switches). Make sure that the server NIC ports and storage NIC ports are connected so that any single component failure in the SAN will not disable access to any storage array volumes.
5.3 VMware vSphere ESXi Server/VM The lab test environment for this paper was comprised of a VMware ESXi server to host SQL Server database virtual machines as well as the QBMF work load simulation, vCenter, and Active Directory virtual machines. The following best practices are applicable for running VMware ESXi based virtual machines in conjunction with EqualLogic Storage and/or Microsoft SQL Server environments.
5.4 Best practices: Data backup using native SQL server tools Follow these best practices for data backup using native SQL server tools and EqualLogic arrays. Database Layout Ensure that SQL Server databases and associated transaction logs each reside in dedicated volumes. Microsoft recommends separating data and log files onto their own volumes in order to separate random I/O going to the data files from sequential I/O going to the log files.
General backup strategy best practices It is very important that backup destinations reside on storage devices (EqualLogic storage pools) that are separate from where the databases are stored. I/O bandwidth can be very critical to the performance of the database. It is recommended to separate the sequential I/O load that is typically generated by backup and restore processing from the random I/O load that is typically generated by transaction processing databases.
Appendix A Test system component details This section contains an overview of both the hardware and software configurations used throughout the testing described in this document. Table 5 Test Configuration Hardware Components Test Configuration SQL Server® (ESXi01) INFRA SERVER LOAD GEN SERVER MONITOR SERVER Network Storage BP1021 Hardware Components One (1) Dell PowerEdge R710 Server running VMware ESXi v4.1, hosting a single SQL Server® Database virtual machine: BIOS Version: 3.0.
Table 6 Test configuration software components Test Configuration Operating systems Applications Monitoring Tools Simulation Tools BP1021 Software Components Host: VMware vSphere ESXi Server v4.1 Guest: Microsoft® Windows Server 2008 R2 Enterprise Edition (virtual machine): • MPIO enabled using EqualLogic DSM for Windows when using guest iSCSI initiator • EqualLogic Host Integration Toolkit(HIT) v3.5.1 installed SQL Server® 2008 R2 Enterprise Edition EqualLogic SAN Headquarters version 2.
Additional resources Support.dell.com is focused on meeting your needs with proven services and support. DellTechCenter.com is an IT Community where you can connect with Dell Customers and Dell employees for the purpose of sharing knowledge, best practices, and information about Dell products and your installations. Referenced or recommended Dell publications: • Dell EqualLogic Configuration Guide at http://www.equallogic.com/resourcecenter/assetview.
THIS WHITE PAPER IS FOR INFORMATIONAL PURPOSES ONLY, AND MAY CONTAIN TYPOGRAPHICAL ERRORS AND TECHNICAL INACCURACIES. THE CONTENT IS PROVIDED AS IS, WITHOUT EXPRESS OR IMPLIED WARRANTIES OF ANY KIND.