
White Papers
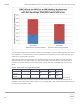
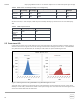
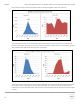
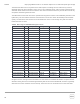
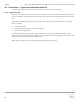
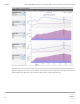
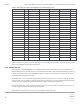
Table Of Contents
- 1 Introduction
- 2 Desktop Virtualization with VMware View
- 3 Infrastructure and test configuration
- 4 View test methodology
- 5 Test results and analysis
- 6 Sizing guidelines for EqualLogic SANs
- 7 Best Practices
- 8 Conclusions
- Appendix A VMware View 5.1 solution configuration
- Appendix B Network design and VLAN configuration
- Appendix C ESXi host network configuration
- Additional resources
BP1033 Deploying VMware View 5.1 on VMware vSphere 5.0 U1 with Dell EqualLogic Storage
24
Table 4 CBRC effect on desktop density on a storage array
Read
percentage
Write
percentage
Total array IOPS (Sample) IOPS/desktop
Total
desktops
CBRC
Disabled
30% 70% 7300 10 730
CBRC
Enabled
12% 88% 6700 8 838
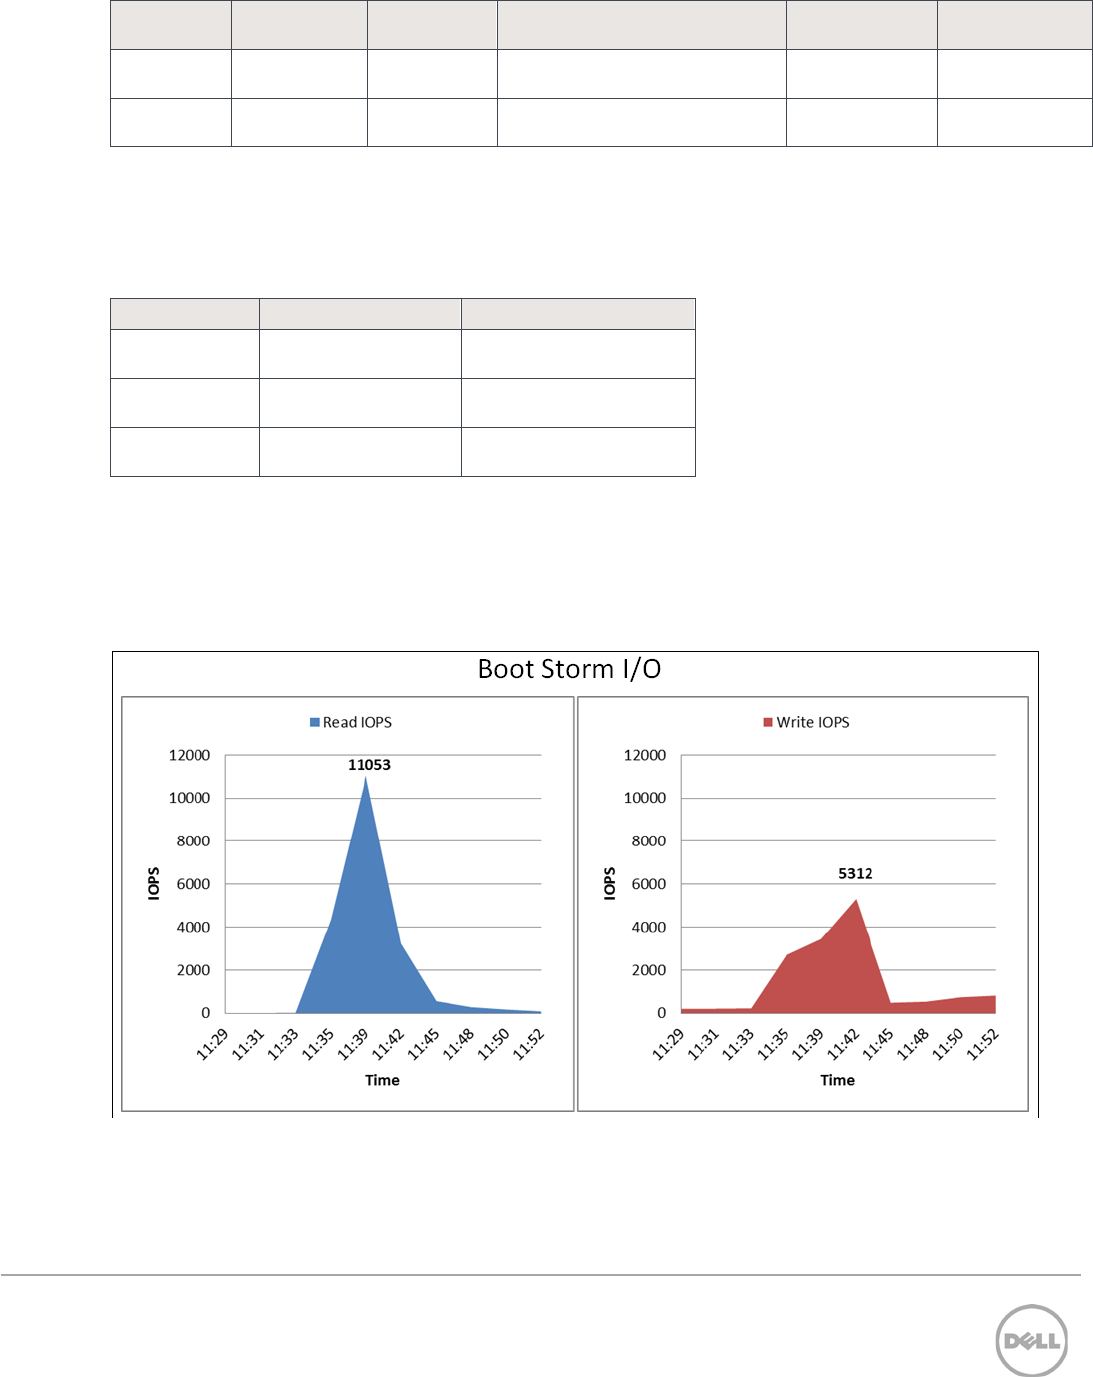
As Table 5 shows, in this example, CBRC improves desktop density by 15% and cost for each desktop by
13%.
Table 5 CBRC improvements
Desktops per array Cost for each desktop
CBRC
Disabled
730 $68
CBRC
Enabled
838 $60
CBRC
Improvement
15% 13%
5.3 Boot storm I/O
In the boot storm test, the virtual desktops were reset simultaneously from the VMware vSphere client to
simulate a boot storm. Figure 5 shows the storage characteristics during the boot storm – the PS6100XS
array delivered nearly 14,500 IOPS (14-18 IOPS per VM) under the peak load during this test.
Figure 5 SAN HQ data showing PS6100XS array IOPS during boot storm
The spike seen in Figure 5 was primarily due to read operations, because the boot process of the virtual
desktops creates many simultaneous reads to the replica image. The read and write ratios during the boot
storm were about 76% reads to 24% writes.