
White Papers

30 BP1036 | Microsoft Exchange 2010 on a Hyper-V Virtual Infrastructure Supported by Dell EqualLogic SANs
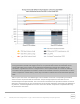
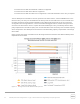
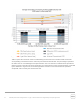
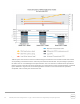
Figure 8 Characterization of different PS Series models in a two node DAG
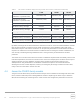
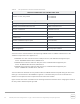
Table 9 reports the numerical results recorded during the assessment of the PS Series model test and the
corresponding normalized values to match the planned and achieved IOPS. The percentages reported in
the IOPS rows are calculated against the planned IOPS. The rows with the normalized values provide the
relative increase or decrease of the Exchange KPI. The responsiveness of the storage subsystem, measured
by the database or log latencies, should be regarded as a function of the total amount of operations
completed, and not merely the transactional load.