Best Practices for Decision Support Systems with Microsoft SQL Server 2012 using Dell EqualLogic PS Series Storage Arrays A Dell EqualLogic Reference Architecture Dell Storage Engineering July 2013
Revisions Date Description July 2013 Initial release © 2013 Dell Inc. All Rights Reserved. Dell, the Dell logo, and other Dell names and marks are trademarks of Dell Inc. in the US and worldwide. All other trademarks mentioned herein are the property of their respective owners.
Table of contents Revisions ............................................................................................................................................................................................. 2 Acknowledgements .......................................................................................................................................................................... 5 Feedback .............................................................................................
7.3 SQL Server Best Practices ............................................................................................................................................ 45 7.3.1 SQL Server startup parameters ................................................................................................................................... 45 7.3.2 Database volume creation ......................................................................................................................................
Acknowledgements This best practice white paper was produced by the following members of the Dell Storage team: Engineering: Lakshmi Devi Subramanian Technical Marketing: Magi Kapoor Editing: Camille Daily Additional contributors: Ananda Sankaran, Darren Miller, Mike Kosacek, and Rob Young Feedback We encourage readers of this publication to provide feedback on the quality and usefulness of this information by sending an email to SISfeedback@Dell.com. SISfeedback@Dell.
1 Introduction DSS solutions require scalable storage platforms that offer high levels of performance and capacity. This paper presents sizing guidelines and best practices for deploying DSS solutions based on the results of SQL Server 2012 I/O performance tests conducted using Dell™ PowerEdge™ servers, Dell™ Force 10™ switches and EqualLogic storage.
1.2 Terminology The following terms are used throughout this document. DSS I/O pattern: DSS workloads typically take a long time to complete and usually require processing large amounts of data that tend to utilize a major portion of the database server memory and processor time. The data I/O pattern is predominantly sequential and usually consists of large blocks, typically ranging from 64 KB to 512 KB in size. The key metric in measuring performance of DSS workloads is throughput (MB/sec).
Range right partition function (SQL Server): Here, each boundary value specifies the lowest value of its partition. All values in partition 1 must be less than the lower boundary of partition 2 and all values in partition 2 must be greater than or equal to partition 2's lower boundary. SAN Headquarters (SAN HQ): Monitors one or more PS Series groups. The tool is a client/server application that runs on a Microsoft Windows system and uses simple network management protocol (SNMP) to query the groups.
2 Dell EqualLogic PS6110 series product overview The Dell EqualLogic PS6110 array is intelligent storage that is designed to provide simple management and seamless expansion. EqualLogic delivers comprehensive end-to-end solutions to store and manage data so that organizations can efficiently move the right data, to the right place, at the right time and for the right cost.
3 Nature of data warehouse workloads and storage Different types of database applications have varying needs. Understanding the models for the most common database application workloads can be useful in predicting possible application behavior. The most common database application workload models are online transaction processing (OLTP) and data warehouse (DW). This paper focuses on DW workloads.
4 Test configuration The SQL Server test system used to conduct testing for this paper is shown in Figure 1 and Figure 2. 4.1 Physical system configuration- SQL Servers The physical connectivity of the two servers that hosted the SQL Server databases used for testing is shown in Figure 1. Other infrastructure components used in the test setup are shown in the high-level diagram in Figure 2.
4.2 High-level system design A high-level overview of the test configuration is shown in Figure 2. Figure 2 High-level overview of the test configuration Key design details of the test system configuration shown in Figure 2 include: • Two R820 Dell PowerEdge servers were used to host two SQL Server instances. Each of these servers had SQL Server 2012 Enterprise Edition installed on Windows Server 2012 Enterprise Edition.
5 Baseline I/O profiling using IOMeter A series of I/O profiling tests were executed using IOMeter, to establish the baseline I/O performance characteristics of the test storage configuration before deploying any databases. Since DSS workloads are mostly sequential with larger I/O block sizes, the baseline throughput numbers were established by running three types of large block I/O workload.
interface is 1280 MB/sec. From the tests conducted, the maximum average read throughput achieved was 1042 MB/sec for a 128K block size and maximum average write throughput achieved was 680 MB/sec for 256K block size.
6 DSS performance studies using TPC-H Benchmark Factory A series of DSS application simulations were conducted using Benchmark Factory as the simulation tool running a TPC-H like workload. TPC-H is an industry standard benchmark for DSS. DSS user queries were run from Benchmark Factory against the database to understand the I/O behavior at the storage arrays when the SQL Server database executed those queries.
Table 2 Database file and volume layout test parameters Configuration Parameters EqualLogic SAN One PS6110X (2.5", 24 10 K SAS drives,900 GB) RAID type RAID 50 SQL DB volume Configuration SQL DB Files- Volume size • • • • • • Primary Data File (.mdf) – 100GB LineItem Table DataFile1 (.ndf) – 600 GB Order Table (.ndf)-300 GB All other tables (.ndf)–200 GB Log File (.
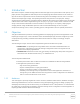
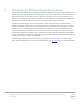
SQL parameters - performance comparisions 700 390 380 650 663 665 370 360 600 344 350 340 550 Time (minute) Read throughput (MB/sec) 385 Read Throughput Query Completion Times 330 500 320 Without SQL tuning parameters Figure 5 With SQL tuning parameters SQL Parameter studies The query completion time is the duration between the first query submission and completion of the last query.
6.2 Table partitioning studies This section evaluates the impact of SQL Server table partitioning on DSS performance in a data warehouse environment. Partitioning breaks up database objects by allowing subsets of data to reside in separate file groups. This is beneficial to data warehouse databases in several ways.
6.2.2 Number of partitions and volumes This test evaluated the performance gains of using more volumes by having more table partitions in each volume. The l_shipdate column in the LineItem table had years ranging from 1992 to 1998. Two table partition test studies were performed. • Four partitions - Placing the data for every two years in a partition. • Eight partitions- Placing the data for every year in a partition.
Figure 6 20 Four and eight table partition data file layout BP1062 | Best Practices for Decision Support Systems with Microsoft SQL Server 2012 using Dell EqualLogic PS Series Storage Arrays
Table 3 Table partition test parameters Configuration parameters EqualLogic SAN One PS6110X (2.5", 24 10 K SAS drives,900 GB) RAID type RAID 50 Table partition pests- volume layout Four partitions (LineItem table, partitioned into four partitions) • Primary data file (.mdf) – 100GB • LineItem table partition1 & non-clustered indexes (.ndf) – 1 TB • LineItem table partition2 (.ndf)-200 GB • LineItem table partition3 (.ndf)-200 GB • LineItem table partition4 (.
Figure 7 shows the test results that were collected while running six users (132 queries) on four partitions and then on eight partitions. The average read throughput remained almost the same since the single array was running at its maximum achievable throughput. However, the query execution time improved during the eight partition test by 11% due to the increased number of volumes. This means more reader threads get issued by SQL Server and fewer volume queue depths seen at the storage.
Table 4 One user power test query response time (seconds) comparison Queries LineItem Table Four Partitions LineItem TableEight Partitions Pricing summary report query (Q1) 335.678 355.918 Minimum cost supplier query (Q2) 11.893 1.158 Shipping priority query (Q3) 291.178 292.457 Order priority checking query (Q4) 348.959 408.225 Local supplier volume query (Q5) 363.942 313.058 Forecasting revenue change query (Q6) 204.53 78.346 Volume shipping query (Q7) 333.83 239.
eight partition test. This was because there were fewer requests queued on each LineItem volume due to data being spanned across more volumes in the eight partition case. This can be seen from Figure 8. Figure 8 shows the average queue depth (or number of outstanding I/Os) of the LineItem volumes (which contained the partitions) from SANHQ. The number of outstanding I/Os on the eight partition test was 41% less compared to the four partition test.
6.3 Columnstore index studies Columnstore index is a new feature in SQL Server 2012 that can be used to speed up the processing time on common data warehousing queries. This section evaluates the benefits of columnstore indexing on a TPC-H DW database, by implementing columnstore indices on the largest tables and then comparing its performance against the database without columnstore indexing. 6.3.
The steps involved in creating a columnstore index are detailed in Microsoft’s IEEE paper “Columnar storage in SQL Server 2012”, that can be found at http://sites.computer.org/debull/A12mar/apollo.pdf. The key steps are: 1. 2. 3. 4. 5. 6. Each column is converted to a set of rows called column segments. (The columnstore index is divided into units of transfer called segments. A segment is stored as a Large Object (LOB), and can consist of multiple pages).
6.3.2 Columnstore index benefits Columnstore Index offers query performance and space saving benefits for SQL Server data warehouse database applications. • Space Savings: The columnstore index is compressed when created. On creation, it uses the VertiPaq™ compression algorithm, which compresses the data more than either page or row compression. These indexes are much smaller than b-tree indexes.
6.3.4 Columnstore index performance comparisons - TPC-H The tests performed in this section evaluate the performance gains in a data warehouse database application when using columnstore indexes on the largest tables. Three tests were performed. • Baseline tests, with no columnstore index on the eight partitions file layout (refer to Figure 6Figure 6). • Implementing columnstore index on the first largest partitioned table (LineItem).
Configuration parameters Columnstore index on LineItem table LineItem table • Eight partitions • Columnstore index aligned with the table partition scheme Columnstore index on LineItem & Order tables LineItem table • Eight partitions • Columnstore index aligned with the table partition scheme Order table • Columnstore index • • • • • • • • • • • • • Primary data file (.mdf) – 100GB LineItem table partition1 & non-clustered indexes (.ndf) – 1 TB LineItem table partition2 (.
The Columnstore Index objects, such as the column segments and dictionaries, do not use the pageoriented buffer pool. Instead, they use their own memory pool which is created automatically by SQL Server memory management and designed for handling large objects. Columnstore Index query operations consume more memory. This can be seen from Figure 10, where six users were run from TPCH on the database with no columnstore index and with columnstore index with 92% of RAM (117.
MB/sec) compared to the read throughput (895 MB/sec) in Figure 7 is due to the change in the memory setting to 115 GB. While implementing the columnstore index on the two largest tables, the query execution time further reduced by 67% compared to the baseline without columnstore indexing and by 21% compared to having the columnstore index on just the largest table. This shows that implementing columnstore index on large tables is beneficial.
Figure 12 shows the increase in percentage CPU utilization when using the columnstore index measured using Perfmon at the SQL Server. Even though the CPU utilization percentage increased, it remained well below 80%. The increase in CPU utilization is attributed to the data compression and other memory management operations involved during the columnstore index query processing.
Figure 13 Baseline without columnstore index (6 users) – SAN HQ pool view 33 BP1062 | Best Practices for Decision Support Systems with Microsoft SQL Server 2012 using Dell EqualLogic PS Series Storage Arrays
Figure 14 Columnstore index on the LineItem table ( 6 users) – SAN HQ pool view Table 6 summarizes the results from the above SANHQ graphs. Table 6 SAN HQ results summary Performance metrics Read/Write % 34 No columnstore index Columnstore index on LineItem table 95.9/4.1 87.1/12.1 Read IO size (KB) 180.81 95.18 Write IO size (KB) 63.84 63.84 Read latency (ms) 148.72 66.03 Write latency (ms) 16.22 2.57 Read IO rate (MB/sec) 921.13 540.55 Write IO rate (MB/sec) 13.74 53.
To check the query execution time improvement in the columnstore index tests shown in Figure 11, the queries were examined individually by running a single user power test (one user with 22 queries run in the same order). The power test was run on the baseline tests (without columnstore index) and columnstore index implemented on the largest partitioned LineItem table. Table 7 shows the comparison of the average query response times taken by each of the 22 queries.
without columnstore index. Using columnstore index along with table partition would help make use of the table partition benefits (such as DW loading and maintenance) as well as the columnstore index benefits of improved query execution times. 6.4 SAN scaling The SAN scaling test measured the throughput scalability as the number of EqualLogic PS Series storage arrays increased within a group. This section covers, • Performance comparisons between IOMeter and TPC-H test results on a single array.
one array. This was because there was no application cache or I/O writes involved with the IOMeter tool. The Benchmark Factory TPC-H database test had SQL Server buffer cache and a small percentage (4%) of I/O writes (Tempdb and Log files) involved causing the difference in throughput. In addition, the workloads were not 100% sequential when the actual TPC-H database was accessed by multiple users. 6.4.
(Six users, one database, two arrays) • 6 users (132 queries) from Benchmark Factory • Database volumes: Refer to Figure 16 Data Warehouse Workload Parameters Database load & Workload generation TPC-H from Benchmark Factory Database size 300 scale (~620 GB including data and indexes) Number for users/streams 6 (As per TPC-H standard, the minimum required streams/users to be run for a 300 scale Database is 6) Queries 22 TPC-H queries per user SQL Server Memory (Max memory allocation) in GB 117.
storage processing controllers (including on-board cache), and the network interfaces. The increased storage throughput that became available as the number of arrays increased allowed faster data fetching by the database. For a constant user load, the queries were also completed faster resulting in decreased completion times when the array was scaled. With two arrays, the completion time was 20% less than with a single array.
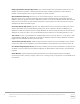
CPU utilization 60 56 % CPU Utilization 50 46 40 Average CPU Utilization 30 Max CPU Utilization 20 10 20 15 0 1xarray 2xarrays Figure 19 CPU utilization comparison 6.4.3 Scaling the arrays and user load- TPC-H In this test, both the arrays and the workload were scaled. As arrays were scaled to two, the number of databases and users were also doubled to push more load on the two arrays. Two databases were deployed with 12 users running 264 queries.
Table 9 Test parameters: SAN scaling Configuration Parameters EqualLogic SAN Two PS6110X (2.
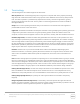
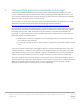
SAN scalability 470 1700 Throughput (MB/sec) 1600 460 462 1400 450 1200 1000 895 440 433 430 800 600 400 Time (minute) 1800 Average Read throughput Query Completion time 420 200 410 0 1xarray 2xarrays Figure 21 SAN Scalability Figure 21 Illustrates that the average read throughput scaled proportionally with the addition of more arrays. The query execution times increased by 6% in the two array scaling tests due to the increase in user load.
The ability to easily scale a data warehouse is crucial for businesses that depend on database applications. From the above scalability tests, the usable capacity and the I/O throughput of the arrays scaled linearly, and without bottlenecks at the servers. The EqualLogic peer storage scale-out architecture increases the available storage resources to accomplish linear scaling.
7 Best practices recommendations This section summarizes the Dell best practices used in the test setup and also the best practices derived by running the tests results presented sections 5-6. 7.1 Storage Use the following best practices when configuring Dell EqualLogic storage arrays for a data warehouse solution. • It is an important to physically separate data warehouse workloads on a separate storage system that is optimized for data warehouse query I/O activity.
7.3 SQL Server Best Practices The following SQL Server best practices were implemented for the tests documented in this paper. 7.3.1 SQL Server startup parameters The following startup options are recommended to be added to the SQL Server Startup options: • -E: This parameter increases the number of contiguous extends in each file that are allocated to a database table as it grows. This option is beneficial because it improves sequential access.
size and the percent growth are set to a reasonable size to avoid the frequent activation of the auto grow feature. Microsoft’s recommendations are: • Leave the auto grow feature on at database creation time to avoid running out of space and also to let SQL Server automatically increase allocated resources when necessary without DBA intervention provided there is physical disk space available.
(LineItem-~300 GB LineItem) and volume size (600 GB), to avoid any issues during query processing. The tempdb I/O profile observed for the TPC-H data warehouse database tests conducted in his paper is shown in Table 10. • A tempdb I/O can be sequential or random. However, running multiple users or workloads can make the tempdb I/O be more random even when the data warehouse workload is sequential.
7.3.7 Columnstore Index The columnstore index study in section 6.3 proved that by using columnstore index on the two largest tables, the data warehouse query execution times improved significantly. Below are the resulting best practices and few things to remember stated by Microsoft when using columnstore index. For details refer to http://msdn.microsoft.com/en-us/library/gg492088.aspx. • Updating data in a columnstore index: Tables that have a columnstore index cannot be updated.
of parallelism). Generally the memory requirements increase as the proportion of columns that are strings increases. Therefore, decreasing the DOP can reduce the memory requirements for building the columnstore index. Creating a columnstore index is a parallel operation, subject to the limitations on the number of CPUs available and any restrictions set on MAXDOP setting.
8 Conclusion In today’s IT world, as data is growing very rapidly, organizations are being stressed to optimize for storage capacity as well as for application performance. Data warehouse applications help organizations achieve better and faster data analytics to improve decision making processes while staying competitive. However, before a data warehouse application is deployed, specific design decisions and principles should be taken into consideration to meet capacity and performance requirements.
A Configuration details This section contains an overview of the hardware configurations used throughout the testing described in this document. Table 12 Test configuration hardware components Test Configuration SQL Server® 1 Hardware Components One PowerEdge R820 server running Windows Server 2012, hosting 1 SQL Server database instance: BIOS Version: 1.4.0 ® ® 4 x 8 Core Intel Xeon E5-4620 Processors 2.
7.4.8 Network 2 x Force10 S4810 10Gb Ethernet Switch, Firmware: 8.3.12.1 Storage 2 x EqualLogic PS6110X: 24 x 900GB 10K RPM SAS disk drives as RAID 50, with two hot spare disks Dual 10GbE controllers running firmware version 6.0.2 This section contains an overview of the software configurations used throughout the testing described in this document.
B Columnstore index T-SQL query to create and align the columnstore Index along the table partition scheme is as follows. USE [300_TPCH_DB] GO SET ANSI_PADDING ON GO CREATE NONCLUSTERED COLUMNSTORE INDEX [NonClusteredColumnStoreIndex-20130620123327] ON [dbo].
Additional resources Support.dell.com is focused on meeting your needs with proven services and support. DellTechCenter.com is an IT Community where you can connect with Dell Customers and Dell employees for the purpose of sharing knowledge, best practices, and information about Dell products and your installations. Referenced or recommended Dell publications: • Dell EqualLogic Configuration Guide: http://en.community.dell.com/dell-groups/dtcmedia/m/mediagallery/19852516/download.
This white paper is for informational purposes only. The content is provided as is, without express or implied warranties of any kind.