
Administrator Guide

Introduction
5 Telemetry Streaming with iDRAC9 Server -Telemetry Performance Reports | ID 457
1 Introduction
This white paper introduces iDRAC9 telemetry performance reports, and respective metrics in those reports.
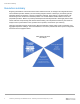
The iDRAC9 telemetry reports can be pulled on demand through Redfish APIs. Or the reports can be
configured to be streamed through HTTP subscription, remote syslog, or Server-Sent Events (SSE) based
methods. For best practices, troubleshooting tips and details on setting up the telemetry report streams, see
the Telemetry Streaming “Getting Started” white paper.
1.1 Terms and Definition
For this technical white paper, following terms and definitions apply:
System Usage Report: Metric report with percentage Compute Utilization Per Second (CUPS). This report
can be pulled on demand through the Redfish API or can be configured to be streamed through HTTP
subscription, remote syslog, or SSE-based methods. (Note: iDRAC versions prior to 4.40.00 refer to this as
“CUPS Usage Report.”)
Aggregation Metrics Report: Aggregation Metrics report is derived from a set of base metric values for
Power, Temperature, and CPU indicating an aggregate value for a set time. It is a “pull only” report and can
be generated on demand through the Redfish API.
CPU Memory Metrics Report: CPU memory metrics and register values. This report can be pulled on
demand through the Redfish API or can be configured to be streamed through HTTP subscription, remote
syslog, or SSE-based-methods.
1.2 Prerequisites
The Telemetry feature is available on iDRAC9 firmware version 4.00.00.00 or above and requires a
Datacenter license.