White Paper Telemetry Streaming with iDRAC9 - Power and Thermal Metrics Abstract Dell EMC PowerEdge Servers with iDRAC9 4.x Datacenter streams data to help IT administrators better understand the inner workings of their server environment. This white paper explains how to use the Telemetry Power and Thermal reports for monitoring and creating graphs for PowerEdge server power and thermal subsystems.
Revisions Revisions Date Description August 2020 Initial release Acknowledgments Authors: Sankara Gara, Cyril Jose, Sailaja, Sankunny The information in this publication is provided “as is.” Dell Inc. makes no representations or warranties of any kind with respect to the information in this publication, and specifically disclaims implied warranties of merchantability or fitness for a particular purpose.
Table of contents Table of contents Revisions.............................................................................................................................................................................2 Acknowledgments ...............................................................................................................................................................2 Table of contents ................................................................................................
Executive summary Executive summary Beginning with iDRAC9 v4.00.00.00 firmware and a Datacenter license, IT managers can integrate advanced server hardware operation telemetry into their existing analytics solutions. Telemetry is provided as granular, timeseries data that is streamed, or pushed, compared to inefficient, legacy polling, or pulled, methods. The advanced agent-free architecture in iDRAC9 provides over 180 data metrics that are related to server and peripherals operations.
Telemetry Overview 1 Telemetry Overview 1.1 Terms and Definitions Telemetry: Telemetry is an automated communications process by which measurements and other data are collected at remote or inaccessible points and transmitted to receiving equipment for monitoring. Telemetry Report: Telemetry (Metric) Report is a DMTF Telemetry specification-compliant JSON document that consists of Metric names, Metric values, and Timestamps.
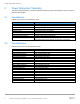
Power Subsystem Telemetry 2 Power Subsystem Telemetry This section describes metrics in the power subsystem telemetry reports and workflows to use the reports to generate useful insights. 2.1 PowerMetrics Following metrics are in the PowerMetric report. Metric TotalCPUPower TotalMemoryPower TotalStoragePower TotalFanPower TotalPciePower SystemInputPower SystemOutputPower SystemPowerConsumption SystemHeadRoomInstantaneous 2.2 PowerStatistics Following metrics are in the PowerStatistics report.
Power Subsystem Telemetry 2.3 PSUMetrics Following metrics are in the PSUMetrics report. Metric FanSpeed Temperature 2.4 Triggers Telemetry reports can be configured to stream automatically on the event of selected triggers at the server. ReportsReports are sent across all active Subscription, SSE, Rsyslog connections. Report PSUMetrics PowerMetrics PowerStatistics 2.
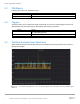
Power Subsystem Telemetry A time lapse Grafana plot of last hour, min, max, and average power consumption from the PowerStatistics report A time lapse Grafana plot of PSU Fan Speed from PSUMetrics report 8 Telemetry Streaming with iDRAC9 - Power and Thermal Metrics | ID 440
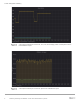
Power Subsystem Telemetry A time lapse Grafana plot of PSU temperature from PSUMetrics report 9 Telemetry Streaming with iDRAC9 - Power and Thermal Metrics | ID 440
Thermal Subsystem Telemetry 3 Thermal Subsystem Telemetry This section describes metrics in the thermal subsystem telemetry reports and workflows to use the reports to generate useful insights. 3.1 ThermalMetrics Following are the metrics in the ThermalMetrics report. Metric ComputePower ITUE PowerToCoolRatio PSUEfficiency SysAirFlowEfficiency SysAirflowPerFanPower SysAirflowPerSysInputPower SysAirflowUtilization SysNetAirflow SysRackTempDelta TotalPSUHeatDissipation 3.2 3.2.
Thermal Subsystem Telemetry 3.2.4 NICSensor The following metric is in the NICSensor report. Metric TemperatureReading 3.2.5 StorageSensor The following metric is in the StorageSensor report. Metric TemperatureReading 3.2.6 Following are the metrics in the ThermalSensor report. Description System board ambient temperature Triggers Telemetry reports can be configured to stream automatically on the event of selected triggers at the server.
Thermal Subsystem Telemetry 3.
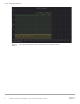
Thermal Subsystem Telemetry A time lapse Grafana plot of PowerToCool from ThermalMetrics report A time lapse Grafana plot of Exhaust Temperature from ThermalSensor report 13 Telemetry Streaming with iDRAC9 - Power and Thermal Metrics | ID 440
Thermal Subsystem Telemetry A time lapse Grafana plot of Exhaust Temperature from StorageSensor report A time lapse Grafana plot of Exhaust Temperature from CPUSensor report 14 Telemetry Streaming with iDRAC9 - Power and Thermal Metrics | ID 440
Thermal Subsystem Telemetry Figure 12. A time lapse Grafana plot of Exhaust Temperature from MemorySensor report Figure 13.
Technical support and resources A Technical support and resources iDRAC Telemetry Workflow examples https://github.com/dell/iDRAC-Telemetry-Scripting/ Open-source iDRAC REST API with Redfish Python and PowerShell examples. https://github.com/dell/iDRAC-Redfish-Scripting The iDRAC support home page provides access to product documents, technical white papers, how-to videos, and more. www.dell.com/support/idrac iDRAC User Guide and other manuals www.dell.com/idracmanuals Dell Technical Support www.Dell.