Dell PowerConnect W-AirWave 7.
Copyright © 2013 Aruba Networks, Inc. Aruba Networks trademarks include , Aruba Networks®, Aruba Wire® less Networks , the registered Aruba the Mobile Edge Company logo, and Aruba Mobility Management System®. Dell™, the DELL™ logo, and PowerConnect™ are trademarks of Dell Inc. All rights reserved. Specifications in this manual are subject to change without notice. Originated in the USA. All other trademarks are the property of their respective owners.
Chapter 1 Overview Congratulations on successfully installing Dell PowerConnect W-AirWave! So where do you go from here? This document is designed to help you with your initial setup. It also provides information on common configuration options and daily monitoring practices.
1. The first step to add a device manually is to select the vendor and model. Browse to the Device Setup > Add page and select the vendor and model of the device to add. Figure 1 illustrates this page. Figure 1: Device Setup > Add Page Illustration 2. Select Add. The Device Communications and Location sections appear, illustrated in Figure 2. 2 | Overview Dell PowerConnect W-AirWave 7.
Figure 2: Device Setup > Add > Device Communications and Location Sections 3. Complete the Device Communications and Location settings for the new device. Settings can differ from device to device based on the type of device and the features that the device supports. In several cases, the default values from any given device derive from the Device Setup > Communication page. 4. In the Location field, select the appropriate group and folder for the device. 5.
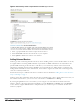
Adding Multiple Devices from a CSV File You can add devices in bulk from a CSV file to AirWave. Here you also have the option of specifying vendor name only, and AirWave will automatically determine the correct type while bringing up the device. If your CSV file includes make and model information, AirWave will add the information provided in the CSV file as it did before. It will not override what you have specified in this file in any way.
Figure 3: Device Setup > Add > Import Devices via CSV Page Illustration 3. Select a group and folder into which to import the list of devices. 4. Select Choose File and select the CSV list file on your computer. 5. Select Upload to add the list of devices into AirWave. Adding Universal Devices AirWave gets basic monitoring information from any device including switches, routers and APs whether or not they are supported devices. Entering SNMP credentials is optional.
How are folders and groups organized? Folders and Groups are useful ways of organizing your devices. Folders are used for monitoring; groups are used for configuration. Group configuration applies to the controller. Configuration for APs is done through the APs/Devices > Manage or APs/Devices List pages. Groups should be comprised of similar devices that will utilize a consistent configuration. Folders are used for filtering devices by location.
Folder views are persistent in AirWave. For example, if you created a folder named "Store1", you can select that folder and then select the Down link in the header section of the page (top), to view only the down devices in the Store1 folder. If you want to see every down device, select the Expand folders to show all APs/Devices link. When the folders are expanded, you see all of the devices on AirWave that satisfy the criteria of the page.
f. Select Add when you are finished, and repeat these steps to add additional credentials on which to enable device scanning. 3. Define a scan set. a. Navigate to the Device Setup > Discover page and select the Add New Scan Set button. b. Select the Network(s) to be scanned and the Credential(s) to be used. AirWave defines a unique scan for each Network/Credential combination. c.
2. Select the check box beside the device or devices that you want to add. 3. Use the drop down menus to select the Group, Folder, and Dell PowerConnect-W AP Group to which the devices will be added. The default group appears at the top of the Group list. NOTE: Devices cannot be added to a Global Group because groups designated as "Global Groups" cannot contain access points. 4. Select either Monitor Only or Manage Read/Write as the mode in which the new device(s) will operate.
2. Specify SNMP Settings. a. Specify an SNMP Timeout value. This is the number of seconds that AirWave will wait for a response from a device after sending an SNMP request, so a smaller number is more ideal. b. Enter a value for SNMP Retries. This value represents the number of times AirWave attempts to poll a device when it does not receive a response within the SNMP Timeout period or the Group's Missed SNMP Poll Threshold setting. As a best practice, we recommend a value of 10. 3.
Chapter 2 Common Configuration Options This section describes common configuration options for triggers, reports, and alerts that you might use on a daily basis. Refer to the following sections for additional information: l "Which triggers should I set up immediately?" on page 11 l "Which reports should I utilize?" on page 17 l "Which alerts are most important to me?" on page 17 Which triggers should I set up immediately? AirWave monitors key aspects of wireless LAN performance.
Figure 5: Client Count Trigger 3. Specify either a maximum (at most) or minimum (at least) value for the client count. 4. Specify the Severity level for the trigger. 5. Specify the Duration during which you want the event to be polled and the conditions of the trigger. For example, you may want to set up a trigger to see if less than two users are on your network for fifteen minutes during a time when you recognize there should be peak activity.
l By Role: When you create a trigger definition, the triggers are visible to only those users who have the same role as you (ie AMP Administrator). l By Triggering Agent: When the trigger is run, this option distributes the alert according to how it was generated. 12. Specify whether to suppress this alert until it has been acknowledged. If you select No, a new alert will be created every time the trigger criteria are met.
3. Specify the Severity level for the trigger. 4. Specify whether the trigger should be based on the number of down events over a specified period of time. When this option is enabled, you can set the number of down events that activate the trigger, as well as the duration of the time window to be measured. AirWave will then count the number of times that the device has gone from Up to Down in the specified span of time and display this in the Device Down alert. 5.
Figure 7: Radio Noise Floor Trigger 3. Specify the Severity level for the trigger. 4. Specify the Duration during which you want the event to be polled and the conditions of the trigger. For example, you may want to set up a trigger to notify you if the Noise Floor (dBM) is greater than -85 for five minutes. 5. Specify the Folder and Group to which this trigger should be applied. You can also select whether to include subfolders of the selected Folder. 6.
10. Select Add when you are finished configuring the trigger. Rogue Device Classified Trigger The Rogue Device Classified trigger can be useful for alerting you when a device has been discovered with the specified Rogue Score. You can define conditions for this trigger that specify the nature of the rogue device in multiple ways. Perform the following steps to configure a Rogue Device Classified trigger. 1. Navigate to the System > Triggers page and click the Add New Trigger button. 2.
7. Specify whether the trigger should display by role or by triggering agent. l By Role: When you create a trigger definition, the triggers are visible to only those users who have the same role as you (ie AMP Administrator). l By Triggering Agent: When the trigger is run, this option distributes the alert according to how it was generated. 8. Specify whether to suppress this alert until it has been acknowledged. If you select No, a new alert will be created every time the trigger criteria are met.
2. Specify a name for your report. The report should reflect the information that you want to generate. For example, if you want to generate an RF Health report for a specific building within your campus, then you might want to name it "Bldg2 RF Health." 3. In the Report Definitions Type drop down, select RF Health. Figure 9: RF Health Report Definitions 18 | Common Configuration Options Dell PowerConnect W-AirWave 7.
4. In the Report Restrictions section, enter the criteria that you want to use to filter your report. Also, specify a desired time range for when the new devices first appeared. 5. By default, this report will only run once. You can specify scheduling options so that the report recurs daily, weekly, monthly, or annually. 6. Specify whether the report should display by role or by subject.
Figure 10: Capacity Planning Report Definitions 4. In the Report Restrictions section, enter the criteria that you want to use to filter your report, and specify a desired time range for when the new devices first appeared. You can also specify to restrict this report to a specific time window and whether to include weekends as part of the capacity plan. 20 | Common Configuration Options Dell PowerConnect W-AirWave 7.
5. By default, this report will only run once. You can specify scheduling options so that the report recurs daily, weekly, monthly, or annually. 6. Specify whether the report should display by role or by subject. l By Role: When you create a report definition, the reports are visible to only those users who have the same role as you (ie AMP Administrator). l By Subject: When the report is run, AirWave users have access to the report if they are allowed to view all the devices in the report. 7.
22 | Common Configuration Options Dell PowerConnect W-AirWave 7.
Chapter 3 Monitoring Practices With AirWave, you can monitor devices on your network with the click of a button and see real-time statistics as well as relevant historical information. Special diagnostic summaries highlight anomalies and situations that can affect end-user network performance. AirWave includes monitoring views specifically designed to aggregate critical information for the service desk, as well as the high-end monitoring functions network engineers need.
Figure 11: APs/Devices > List (partial view) Monitoring Data for Wired Devices (Routers and Switches) The monitoring page for routers and switches includes basic device information at the top, a bandwidth graph depicting the sum of all the physical interfaces. Beneath that are CPU/Memory utilization graphs as shown in Figure 12. Figure 12: APs/Devices > Monitor Page for a Mobility Access Switch 24 | Monitoring Practices Dell PowerConnect W-AirWave 7.
All managed wired devices also include an Interfaces subtab, as shown in Figure 13. Figure 13: APs/Devices > Interfaces Page for Wired Devices (partial view) . The Interfaces page includes a summary of all the interfaces at the top. In case of the stacked switches, the master includes the interfaces of all the members including its own. The physical and the virtual interfaces are displayed in separate tables, labeled Physical Interfaces and Virtual Interfaces. VLANs are listed below the interface.
Figure 14: Monitoring Page Top Level Data Common to All Device Types The alert summary and recent events sections are also the same regardless of the device type, and these sections appear toward the bottom of these pages. In addition, a link to the Audit Log is available on the bottom of this page. A portion of this page is shown in Figure 15.
An Interface Monitoring page is comprised of three sections: Interface Information, Usage and Interface Frame Counters graphs, and Connected Clients. Specifics of the interface are in the Interface Information section, as depicted in Figure 17. Figure 17: Individual Interface Information Section Bandwidth and other frame-counter information are displayed in the lower section in a tabbed graph, which is shown in Figure 16 above.
Figure 20: Drill down to view all clients When the client information is displayed, an additional drill down is available to view information for a specific client, device, or location. NOTE: When you click on a Username in the Client page, the drill down takes you to the Clients > Diagnostics page. Navigate to the Clients > Client Details page for additional detailed information about the selected client. 28 | Monitoring Practices Dell PowerConnect W-AirWave 7.