
Concept Guide


60 | Instant User Interface Dell Networking W-Series Instant 6.4.3.1-4.2.0.0 | User Guide
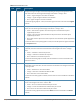
Icon Name Description
1 Signal Icon Displays the signal strength of the client. Depending on the signal strength of the client,
the color of the lines on the Signal bar changes from Green > Orange > Red.
l Green— Signal strength is more than 20 decibels.
l Orange— Signal strength is between 15-20 decibels.
l Red— Signal strength is less than 15 decibels.
To view the signal graph for a client, click on the signal icon next to the client in the Signal
column.
2 Speed icon Displays the data transfer speed of the client. Depending on the data transfer speed of the
client, the color of the Signal bar changes from Green > Orange > Red.
l Green— Data transfer speed is more than 50 percent of the maximum speed
supported by the client.
l Orange— Data transfer speed is between 25-50 percent of the maximum speed
supported by the client.
l Red— Data transfer speed is less than 25 percent of the maximum speed supported by
the client.
To view the data transfer speed graph of a client, click on the speed icon against the client
in the Speed column.
3 Utilization
icon
Displays the radio utilization rate of the W-IAPs. Depending on the percentage of
utilization, the color of the lines on the Utilization icon changes from Green > Orange >
Red.
l Green— Utilization is less than 50 percent.
l Orange— Utilization is between 50-75 percent.
l Red— Utilization is more than 75 percent.
To view the utilization graph of a W-IAP, click the Utilization icon next to the W-IAP in the
Utilization column.
4 Noise icon Displays the noise floor details for the W-IAPs. Noise is measured in decibels/meter.
Depending on the noise floor, the color of the lines on the Noise icon changes from Green
> Orange > Red.
l Green— Noise floor is more than 87 dBm.
l Orange— Noise floor is between 80 dBm-87 dBm.
l Red— Noise floor is less than 80 dBm.
To view the noise floor graph of a W-IAP, click the noise icon next to the W-IAP in the Noise
column.
5 Errors icon Displays the errors for the W-IAPs. Depending on the errors, color of the lines on the
Errors icon changes from Green > Yellow > Red.
l Green— Errors are less than 5000 frames per second.
l Orange— Errors are between 5000-10000 frames per second.
l Red— Errors are more than 10000 frames per second.
To view the errors graph of a W-IAP, click the Errors icon next to the W-IAP in the Errors
column.
Table 11: RF Dashboard Icons