
Concept Guide
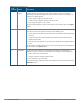
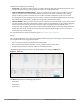

The following table describes the graphs displayed in the Access Point view:
Graph Name W-IAP Description Monitoring Procedure
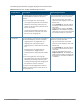
Neighboring
W-IAPs
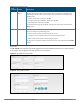
The Neighboring W-IAPs graph shows the
number of W-IAPs detected by the
selected W-IAP:
l Valid W-IAPs: A W-IAP that is part of
the enterprise providing WLAN
service.
l Interfering W-IAPs: A W-IAP that is
seen in the RF environment but is not
connected to the network.
l Rogue W-IAPs: An unauthorized W-IAP
that is plugged into the wired side of
the network.
To see the number of different types of
neighboring W-IAPs for the last 15
minutes, move the cursor over the
respective graph lines.
To check the neighboring W-IAPs detected by the W-
IAP for the last 15 minutes:
1. Log in to the Instant UI. The Virtual Controller
view is displayed. This is the default view.
2. On the Access Points tab, click the W-IAP for
which you want to monitor the client association.
3. Study the Neighboring W-IAPs graph in the
Overview section. For example, the graph shows
that 148 interfering W-IAPs are detected by the
W-IAP at 12:04 hours.
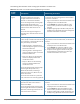
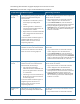
CPU Utilization The CPU Utilization graph displays the
utilization of CPU for the selected W-IAP.
To see the CPU utilization of the W-IAP,
move the cursor over the graph line.
To check the CPU utilization of the W-IAP for the last
15 minutes:
1. Log in to the Instant UI. The Virtual Controller
view is displayed. This is the default view.
2. On the Access Points tab, click the W-IAP for
which you want to monitor the client association.
3. Study the CPU Utilization graph in the Overview
pane. For example, the graph shows that the CPU
utilization of the W-IAP is 30% at 12:09 hours.
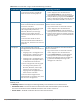
Neighboring
Clients
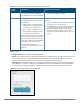
The Neighboring Clients graph shows the
number of clients not connected to the
selected W-IAP, but heard by it.
l Any client that successfully
authenticates with a valid W-IAP and
passes encrypted traffic is classified
as a valid client.
l Interfering: A client associated to any
W-IAP and is not valid is classified as
an interfering client.
To see the number of different types of
neighboring clients for the last 15
minutes, move the cursor over the
respective graph lines.
To check the neighboring clients detected by the W-
IAP for the last 15 minutes,
1. Log in to the Instant UI. The Virtual Controller
view is displayed. This is the default view.
2. On the Access Points tab, click the W-IAP for
which you want to monitor the client association.
3. Study the Neighboring Clients graph in the
Overview pane. For example, the graph shows
that 20 interfering clients were detected by the
W-IAP at 12:15 hours.
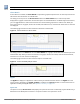
Memory free
(MB)
The Memory free graph displays the
memory availability of the W-IAP in MB.
To check the free memory of the W-IAP for the last
15 minutes:
1. Log in to the Instant UI. The Virtual Controller
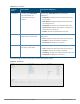
Table 14: Access Point View—Usage Trends and Monitoring Procedures
Dell Networking W-Series Instant 6.5.1.0-4.3.1.0 | User Guide Instant User Interface | 46