
Concept Guide

47 | Instant User Interface Dell Networking W-Series Instant 6.5.1.0-4.3.1.0 | User Guide
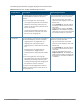
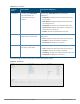
Graph Name W-IAP Description Monitoring Procedure
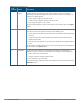
To see the free memory of the W-IAP,
move the cursor over the graph line.
view is displayed. This is the default view.
2. On the Access Points tab, click the W-IAP for
which you want to monitor the client association.
3. Study the Memory free graph in the Overview
pane. For example, the graph shows that the free
memory of the W-IAP is 64 MB at 12:13 hours.
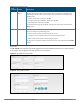
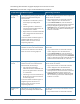
Clients The Clients graph shows the number of
clients associated with the selected W-IAP
for the last 15 minutes.
To see an enlarged view, click the graph.
The enlarged view provides Last,
Minimum, Maximum, and Average
statistics for the number of clients
associated with the W-IAP for the last 15
minutes.
To see the exact number of clients
associated with the selected W-IAP at a
particular time, move the cursor over the
graph line.
To check the number of clients associated with the
W-IAP for the last 15 minutes:
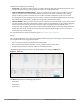
1. Log in to the Instant UI. The Virtual Controller
view is displayed. This is the default view.
2. On the Access Points tab, click the W-IAP for
which you want to monitor the client association.
3. Study the Clients graph. For example, the graph
shows that six clients are associated with the W-
IAP at 12:11 hours.
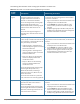
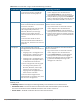
Throughput The Throughput graph shows the
throughput for the selected W-IAP for the
last 15 minutes.
l Outgoing traffic—Throughput for the
outgoing traffic is displayed in green.
It is shown above the median line.
l Incoming traffic—Throughput for the
incoming traffic is displayed in blue. It
is shown below the median line.
To see an enlarged view, click the graph.
l The enlarged view provides Last,
Minimum, Maximum, and Average
statistics for the incoming and
outgoing traffic throughput of the W-
IAP for the last 15 minutes.
To see the exact throughput of the
selected W-IAP at a particular time, move
the cursor over the graph line.
To check the throughput of the selected W-IAP for
the last 15 minutes:
1. Log in to the Instant UI. The Virtual Controller
view is displayed. This is the default view.
2. On the Access Points tab, click the W-IAP for
which you want to monitor the throughput.
3. Study the Throughput graph. For example, the
graph shows 44.03 Kbps incoming traffic
throughput at 12:08 hours.
Table 14: Access Point View—Usage Trends and Monitoring Procedures
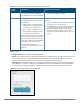
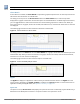
Mobility Trail
The Mobility Trail section displays the following mobility trail information for the selected client:
l Association Time—The time at which the selected client was associated with a particular W-IAP.
The Instant UI shows the client and W-IAP association over the last 15 minutes.
l Access Point—The W-IAP name with which the client was associated.