
Users Guide
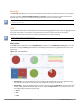
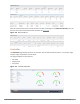
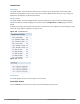
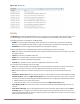
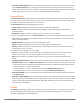
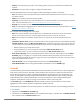
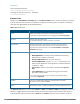
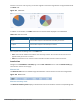
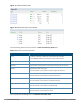
Table Of Contents
- Contents
- About this Guide
- The Basic User-Centric Networks
- Understanding Basic Deployment and Configuration Tasks
- Controller Configuration Workflow
- Connect the Controller to the Network
- W-7000 Series and W-7200 Series Controllers
- Using the LCD Screen
- Configuring a VLAN to Connect to the Network
- Enabling Wireless Connectivity
- Enabling Wireless Connectivity
- Configuring Your User-Centric Network
- Replacing a Controller
- Control Plane Security
- Control Plane Security Overview
- Configuring Control Plane Security
- Managing AP Whitelists
- Managing Whitelists on Master and Local Controllers
- Working in Environments with Multiple Master Controllers
- Replacing a Controller on a Multi-Controller Network
- Configuring Control Plane Security after Upgrading
- Troubleshooting Control Plane Security
- Software Licenses
- Network Configuration Parameters
- IPv6 Support
- Understanding IPv6 Notation
- Understanding IPv6 Topology
- Enabling IPv6
- Enabling IPv6 Support for Controller and APs
- Filtering an IPv6 Extension Header (EH)
- Configuring a Captive Portal over IPv6
- Working with IPv6 Router Advertisements (RAs)
- RADIUS Over IPv6
- TACACS Over IPv6
- DHCPv6 Server
- Understanding ArubaOS Supported Network Configuration for IPv6 Clients
- Understanding ArubaOS Authentication and Firewall Features that Support IPv6
- Managing IPv6 User Addresses
- Understanding IPv6 Exceptions and Best Practices
- Link Aggregation Control Protocol
- OSPFv2
- Tunneled Nodes
- Authentication Servers
- MAC-based Authentication
- Branch Controller Config for Controllers
- Branch Deployment Features
- Scalable Site-to-Site VPN Tunnels
- Layer-3 Redundancy for Branch Controller Masters
- WAN Failure (Authentication) Survivability
- WAN Health Check
- WAN Optimization through IP Payload Compression
- Interface Bandwidth Contracts
- Branch Integration with a Palo Alto Networks (PAN) Portal
- Branch Controller Routing Features
- Cloud Management
- Zero-Touch Provisioning
- Using Smart Config to create a Branch Config Group
- PortFast and BPDU Guard
- Preventing WAN Link Failure on Virtual APs
- Branch WAN Dashboard
- 802.1X Authentication
- Stateful and WISPr Authentication
- Certificate Revocation
- Captive Portal Authentication
- Understanding Captive Portal
- Configuring Captive Portal in the Base Operating System
- Using Captive Portal with a PEFNG License
- Sample Authentication with Captive Portal
- Configuring Guest VLANs
- Configuring Captive Portal Authentication Profiles
- Enabling Optional Captive Portal Configurations
- Personalizing the Captive Portal Page
- Creating and Installing an Internal Captive Portal
- Creating Walled Garden Access
- Enabling Captive Portal Enhancements
- Netdestination for AAAA Records
- Virtual Private Networks
- Planning a VPN Configuration
- Working with VPN Authentication Profiles
- Configuring a Basic VPN for L2TP/IPsec
- Configuring a VPN for L2TP/IPsec with IKEv2
- Configuring a VPN for Smart Card Clients
- Configuring a VPN for Clients with User Passwords
- Configuring Remote Access VPNs for XAuth
- Working with Remote Access VPNs for PPTP
- Working with Site-to-Site VPNs
- Working with VPN Dialer
- Roles and Policies
- ClearPass Policy Manager Integration
- Virtual APs
- Adaptive Radio Management
- Understanding ARM
- Client Match
- ARM Coverage and Interference Metrics
- Configuring ARM Profiles
- Assigning an ARM Profile to an AP Group
- Using Multi-Band ARM for 802.11a/802.11g Traffic
- Band Steering
- Dynamic Bandwidth Switch
- Enabling Traffic Shaping
- Spectrum Load Balancing
- Reusing Channels to Control RX Sensitivity Tuning
- Configuring Non-802.11 Noise Interference Immunity
- Troubleshooting ARM
- Wireless Intrusion Prevention
- Working with the Reusable Wizard
- Monitoring the Dashboard
- Detecting Rogue APs
- Working with Intrusion Detection
- Configuring Intrusion Protection
- Configuring the WLAN Management System
- Understanding Client Blacklisting
- Working with WIP Advanced Features
- Configuring TotalWatch
- Administering TotalWatch
- Tarpit Shielding Overview
- Configuring Tarpit Shielding
- Access Points
- Important Points to Remember
- Basic Functions and Features
- AP Settings Triggering a Radio Restart
- Naming and Grouping APs
- Understanding AP Configuration Profiles
- Before you Deploy an AP
- Enable Controller Discovery
- Enable DHCP to Provide APs with IP Addresses
- AP Provisioning Profiles
- Configuring Installed APs
- Optional AP Configuration Settings
- RF Management
- Optimizing APs Over Low-Speed Links
- AP Scanning Optimization
- Channel Group Scanning
- Configuring AP Channel Assignments
- Managing AP Console Settings
- Link Aggregation Support on W-AP220 Series, W-AP270 Series, and W-AP320 Series
- Recording Consolidated AP-Provisioned Information
- Service Tag
- Secure Enterprise Mesh
- Mesh Overview Information
- Mesh Configuration Procedures
- Understanding Mesh Access Points
- Understanding Mesh Links
- Understanding Mesh Profiles
- Understanding Remote Mesh Portals (RMPs)
- Understanding the AP Boot Sequence
- Mesh Deployment Solutions
- Mesh Deployment Planning
- Configuring Mesh Cluster Profiles
- Creating and Editing Mesh Radio Profiles
- Creating and Editing Mesh High-Throughput SSID Profiles
- Configuring Ethernet Ports for Mesh
- Provisioning Mesh Nodes
- Verifying Your Mesh Network
- Configuring Remote Mesh Portals (RMPs)
- Increasing Network Uptime Through Redundancy and VRRP
- RSTP
- PVST+
- Link Layer Discovery Protocol
- IP Mobility
- External Firewall Configuration
- Palo Alto Networks Firewall Integration
- Remote Access Points
- About Remote Access Points
- Configuring the Secure Remote Access Point Service
- Deploying a Branch/Home Office Solution
- Enabling Remote AP Advanced Configuration Options
- Understanding Split Tunneling
- Understanding Bridge
- Provisioning Wi-Fi Multimedia
- Reserving Uplink Bandwidth
- Provisioning 4G USB Modems on Remote Access Points
- Provisioning RAPs at Home
- Configuring W-IAP3WN and W-IAP3WNP Access Points
- Converting an IAP to RAP or CAP
- Enabling Bandwidth Contract Support for RAPs
- RAP TFTP Image Upgrade
- Virtual Intranet Access
- Spectrum Analysis
- Understanding Spectrum Analysis
- Creating Spectrum Monitors and Hybrid APs
- Connecting Spectrum Devices to the Spectrum Analysis Client
- Configuring the Spectrum Analysis Dashboards
- Customizing Spectrum Analysis Graphs
- Working with Non-Wi-Fi Interferers
- Understanding the Spectrum Analysis Session Log
- Viewing Spectrum Analysis Data
- Recording Spectrum Analysis Data
- Troubleshooting Spectrum Analysis
- Dashboard Monitoring
- Management Access
- Configuring Certificate Authentication for WebUI Access
- Secure Shell (SSH)
- WebUI Session Timer
- Enabling RADIUS Server Authentication
- Connecting to an W-AirWave Server
- Custom Certificate Support for RAP
- Implementing a Specific Management Password Policy
- Configuring AP Image Preload
- Configuring Centralized Image Upgrades
- Managing Certificates
- Configuring SNMP
- Enabling Capacity Alerts
- Configuring Logging
- Enabling Guest Provisioning
- Managing Files on the Controller
- Setting the System Clock
- ClearPass Profiling with IF-MAP
- Whitelist Synchronization
- Downloadable Regulatory Table
- 802.11u Hotspots
- Hotspot 2.0 Pre-Deployment Information
- Hotspot Profile Configuration Tasks
- Hotspot 2.0 Overview
- Configuring Hotspot 2.0 Profiles
- Configuring Hotspot Advertisement Profiles
- Configuring ANQP Venue Name Profiles
- Configuring ANQP Network Authentication Profiles
- Configuring ANQP Domain Name Profiles
- Configuring ANQP IP Address Availability Profiles
- Configuring ANQP NAI Realm Profiles
- Configuring ANQP Roaming Consortium Profiles
- Configuring ANQP 3GPP Cellular Network Profiles
- Configuring H2QP Connection Capability Profiles
- Configuring H2QP Operator Friendly Name Profiles
- Configuring H2QP Operating Class Indication Profiles
- Configuring H2QP WAN Metrics Profiles
- Adding Local Controllers
- Voice and Video
- AirGroup
- Zero Configuration Networking
- AirGroup Solution
- AirGroup Deployment Models
- Features Supported in AirGroup
- ClearPass Policy Manager and ClearPass Guest Features
- Auto-association and Controller-based Policy
- Best Practices and Limitations
- Integrated Deployment Model
- Controller Dashboard Monitoring
- Configuring the AirGroup-CPPM Interface
- Bluetooth-Based Discovery and AirGroup
- AirGroup mDNS Static Records
- mDNS AP VLAN Aggregation
- mDNS Multicast Response Propagation
- Troubleshooting and Log Messages
- Instant AP VPN Support
- External Services Interface
- External User Management
- Behavior and Defaults
- DHCP with Vendor-Specific Options
- 802.1X Configuration for IAS and Windows Clients
- Acronyms and Terms

sessions in the chart. Click any entry on the chart legend to view more usage details. The figure below shows
the Chart view:
Figure 181 Chart View
In addition to the element, the Table view shows the common fields displayed in the table below:
Column Description
Bytes Total number of bytes transmitted and received by an element.
Tx Bytes Total number of bytes transmitted by an element.
Rx Bytes Total number of bytes received by an element.
Table 176: Table View Fields
You can perform the following tasks in the Table view:
l Sort: click a column header of the table to sort the list by column. You can also use the sort icon that
appears when you click on a column.
l Filter: click the filter icon on the first column and select the filter criterion to filter the entries.
Details View
Navigate to the Dashboard > Firewall page. Click the All <element> link to view the Details View page.
There are four sections on this page.
Element Tab
The Element Tab shows the available usage detail elements. Click an element to view more usage details:
Figure 182 Element Tab
Element Summary View
The Element Summary View displays a detailed view of all the six elements and their corresponding fields:
Dell Networking W-Series ArubaOS 6.5.x | User Guide Dashboard Monitoring |
819