
Administrator Guide

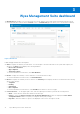
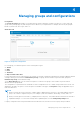


Table Of Contents
- Dell Wyse Management Suite Version 1.0 Administrator’s Guide
- Introduction to Wyse Management Suite
- Getting started with Wyse Management Suite
- Wyse Management Suite dashboard
- Managing groups and configurations
- Configuring global level policy
- Configuring group level policy
- Configuring device level policy
- Group tree hierarchy
- Unmanaged group
- Configuring ThinOS policy settings
- ThinOS—Wizard mode
- ThinOS—Advanced mode
- Configuring general settings—ThinOS 8.5+
- Configuring general settings—ThinOS
- Configuring security settings—ThinOS
- Configuring keyboard settings—ThinOS 8.5+
- Display
- Configuring visual experience settings—ThinOS
- Schedule shutdown or reboot settings—ThinOS 8.5+
- Configuring device information
- Configuring BIOS settings—ThinOS
- Configuring firmware upgrade
- Configuring global INI settings—ThinOS 8.5+
- Configuring central configuration settings—ThinOS
- Configuring advanced settings—ThinOS
- Configuring remote connections—ThinOS
- Configuring global session settings—ThinOS 8.5+
- Configuring USB redirection settings—ThinOS 8.5+
- Configuring third party authentication settings—ThinOS 8.5+
- Configuring citrix broker connection settings—ThinOS 8.5+
- Configuring citrix HDX connection settings—ThinOS 8.5+
- Configuring VMware broker connection settings—ThinOS 8.5+
- Configuring VMware PCoIP connections—ThinOS 8.5+
- Configuring Microsoft broker connection settings—ThinOS 8.5+
- Configuring Microsoft RDP connection settings—ThinOS 8.5+
- Configuring vWorksapce broker connection settings—ThinOS 8.5+
- Configuring AWS broker connection settings—ThinOS 8.5+
- Configuring direct RDP connection settings—ThinOS 8.5 and later versions
- Configuring direct ICA connection settings—ThinOS 8.5+
- Configuring global printer settings—ThinOS 8.5+
- Configuring printer settings—ThinOS 8.5+
- Configuring WLAN global settings—ThinOS 8.5+
- Configuring WLAN connections—ThinOS 8.5+
- Configuring Windows Embedded Standard policy settings
- Configuring system personalization
- Configuring desktop experience
- Configuring network settings
- Configuring security and lockdown settings
- Configuring other settings
- Configuring remote connection settings—Citrix
- Configuring remote connection settings—VMware
- Configuring remote connection settings—RDP
- Configuring remote connection settings—Browser
- Latitude mobile thin client BIOS settings
- Wyse 7040 thin client BIOS settings
- Configuring device information
- Configuring Wyse Easy Setup settings
- Configuring VNC settings
- Configuring domain settings
- Configuring Linux policy settings
- Configuring ThinLinux policy settings
- System personalization
- Desktop experience
- Login experience
- Network
- Configuring security settings
- Central configuration
- Other settings
- VDI Global Settings
- Remote connection—Citrix
- Remote connection—VMware
- Remote connection—RDP
- Remote connection—Browser
- Advanced settings
- Configuring device information
- Configuring Wyse 3040 thin client BIOS settings
- Configuring Wyse Software thin client policy settings
- Configuring system personalization
- Configuring desktop experience
- Configuring network settings
- Configuring security and lockdown settings
- Configuring other settings
- Configuring remote connection settings—Citrix
- Configuring remote connection settings—VMware
- Configuring remote connection settings—RDP
- Configuring remote connection settings—Browser
- Configuring device information
- Configuring VNC settings
- Configuring domain settings
- Managing devices
- Using filters
- Registering devices into Wyse Management Suite
- Registering ThinOS thin clients through WDA User Interface
- Registering Windows Embedded Standard thin clients through Wyse Device Agent User Interface
- Registering Linux thin clients through Wyse Device Agent User Interface
- Registering devices by using DHCP option tags
- Registering devices by using DNS SRV record
- Viewing and managing device details
- Pulling Windows Embedded Standard or ThinLinux image
- Pulling log file
- Renaming thin client
- Apps and data
- Configuring app inventory
- Deploying applications to thin clients
- Adding Windows Embedded Standard operating system and ThinLinux images to inventory
- Managing ThinOS firmware inventory
- Managing Windows Embedded Standard and ThinLinux image policies
- Managing file repository
- Changing wallpaper for all devices belonging to marketing group
- Managing rules
- Managing Jobs
- Events
- Managing users
- Portal administration
- Installing or upgrading Wyse Device Agent
- Wyse Management Suite feature matrix
- Supported thin clients on Wyse management Suite
- Wireless profiles password editor
- Creating and configuring DHCP option tags
- Creating and configuring DNS SRV records

Wyse Management Suite dashboard
The Dashboard page enables you to view the status of a system, and the recent tasks that are performed within the system.
To view a particular alert, click the link in the Alerts section. The Dashboard page also allows you to view the device summary.
Figure 1. Dashboard
Dashboard page includes the following links:
● Alerts—Displays the summary of all the alerts. You can navigate to the functional areas of the system that requires your
attention. The Alerts section displays the following attributes:
○ Devices Not Checked In
○ App Compliance
○ Other Device Alerts
To view the detailed list of all the alerts, click View All Alerts.
● Events—Displays the summary of events that have occurred in the last few days.
To view the detailed list of all the events, click View All Events.
● Devices—Displays the summary of device statuses. The Summary section displays the device count based on the following
device status category:
○ Compliant
○ Pending
○ Unmanaged
○ Non-Compliant
To view the detailed list of all the devices, click View All which redirects to the Device page.
● User Preferences— On the upper-right corner, click the login drop-down menu to perform the following actions:
○ Alerts—Select the alert classification and the notification type.
○ Policies—Select the Ask me if I want to use the ThinOS Wizard mode check box to display the Select ThinOS
Configuration Mode window every time you configure ThinOS policy settings.
○ Page Size—Enter the number of options to be displayed on the screen. The range is 10–100.
3
12 Wyse Management Suite dashboard