
Product Manual

Copyright 2006, Delmhorst Instrument Co.
Page 17 of 32
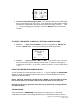
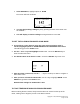
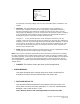
• The first line indicates the Moisture Content (MC) job being analyzed.
• The second line shows the number of readings stored in the specific job
• The third line shows the Average MC value for all stored readings in the specific
job.
• The fourth line shows the Standard Deviation for the specific job.
• The fifth line shows the Coefficient of Variation for the specific job.
• Selecting “MORE” gives the user access to the second set of statistical data.
• Selecting “DONE” returns the user to the storage menu screen.
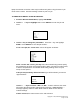
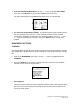
NOTE:
The second set of calculations may require significant processing time, depending on
the number of readings stored in the specific job. The meter will display a screen with
the word “PROCESSING…” while calculations take place. User input is ignored during
this time. Control is returned to the user once the algorithm is complete and the second
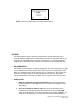
statistics screen is shown, as in the example below:
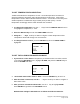
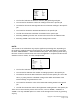
• The first line indicates the specific MC job.
• The second line indicates the number of readings present in the specific job.
• The third line shows the 95% Confidence Interval for the specific job. This is the
value (+/-) away from the calculated average value within which 95% of the
stored readings are guaranteed to exist.
• The fourth line shows the value of the lowest MC reading stored in the specific
job.
• The fifth line shows the value of the highest MC reading stored in the specific job.
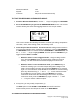
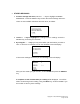
There are no control entries present in this screen, such as “MORE”, “CANCEL” or
“DONE”. The only available option is to return to the storage menu screen, by pressing
any key.