
Human Machine Interface User Manual
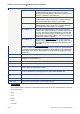
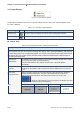
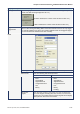
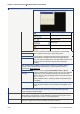
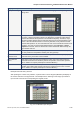
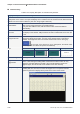
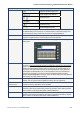
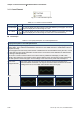
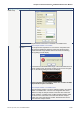
Table Of Contents
- Cover
- Preface
- Table of Contents
- Chapter 1 Introduction
- Chapter 2 Creating and Editing Screens
- 2.1 ScrEdit (Screen Editor) Setup
- 2.2 How to Start ScrEdit
- 2.3 Menu Bar and Toolbar (File)
- 2.4 Menu Bar and Toolbar (Edit)
- 2.5 Menu Bar and Toolbar (View)
- 2.6 Menu Bar and Toolbar (Element)
- 2.7 Menu Bar and Toolbar (Screen)
- 2.8 Menu Bar and Toolbar (Tools)
- 2.9 Menu Bar and Toolbar (Options)
- 2.10 Menu Bar and Toolbar (Window)
- 2.11 Menu Bar and Toolbar (Help)
- Chapter 3 Element Function
- Chapter 4 Macro Function
- Chapter 5 Control Block and Status Block
- Chapter 6 Internal Memory
- Chapter 7 Example Explanation
- Appendix A Specifications and Installation
- Appendix B USB Flash Drive Function
- Appendix C Main Menu Operation of HMI System

Chapter 3 Element Function|ScrEdit Software User Manual
3-52 Revision Apr. 30th, 2007, 2007PDD23000002
3.11 Curve Element
Fig. 3.11.1 Curve element options
Table 3.11.1 Function of Curve elements
Element Type Icon Function
Trend Graph
It is used to display the value change of the read address by trend graph. The trend
graph can display and set the change of Y-axis.
X-Y Chart
It is used to display the value change of the read address by trend graph. The trend
graph can display and set the change of X-axis and Y-axis simultaneously.
Trend Graph
Table 3.11.2 Property Description of Trend Graph Element
Property Description of Trend Graph Element
The first step for setting trend graph is to set the curve number in “Curve Field Total” option (range is 1~4) in
property table. Then, setting the read address, read format, curve width and color in “Detail Setup” option to
complete the setup.
The trend graph will continuously read numbers of addresses from the read address set by the user, convert
the read data into trend graph and display on HMI screen. The numbers of the addresses is determined by
the setting of “Sample Number”.
This function is used to read the values of the internal memory addresses and display on HMI screen
statically. After setting, the user needs to set the specific address of the control block to trigger the drawing
and clear operation of the trend graph. For the settings of the control block, please refer to Chapter 5.
Border Color
Background Color
Border Color option can be set only when the style of the trend graph element is
selected as Raised and Sunken. The style of the element below is selected as “Raised”.
Its background color is set to black and its border color is set to gray.
Standard Raised Sunken Style
Curve Field Total 1~4 curves can be set and displayed.