
User's Manual

Chapter 3 Creating and Editing Screens
Create a Printed Report
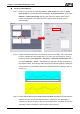
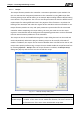
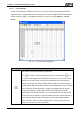
Step 1. Create a new screen by selecting Screen > New Screen and set it as Apply
Print Screen in Screen Properties tab (Screen > Screen Properties). Then, click
Options > Print Typesetting and drag the mouse to decide which screen
needs to be typeset. The selected screens will become the print screen
automatically.
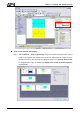
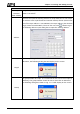
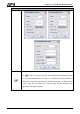
Step 2. Create the element that the user wants to print. For example, if the user wants
to print a Historical Trend Graph and a X-Y Chart, the user needs to create a
Historical Trend Graph (Element > Sampling > Historical Trend Graph) and a
X-Y Chart (Element > Curve > X-Y Chart) first and then set their properties in
the Property table. The Property table provides the element property setting for
each element. For information about each element property settings, refer to
section 3.8.
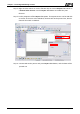
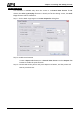
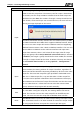
Step 3. Choose Yes or No using the Print Successive Data drop-down list to determine
whether the Print Successive Data function is selected or not. When Yes is
selected, it indicates that Print Successive Data function is enabled, and all the
sampling records and data for the element will be printed.
3-250 Revision May, 2010