
User Manual


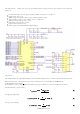


For low frequency range, the spectral characteristic was traced by a network analyzer function, with the ZmodDAC connected to a
ZmodADC, as shown in
Fig. 7. Since the ZmodADC BW is much wider, the overall system frequency characteristic represents the
ZmodDAC characteristic. The BW is flat within 0.1dB up tp 10MHz+.
Figure 7. Low frequency AWG spectral characteristics []
However, the figure Fig. 7 cannot show the high frequency range of the Zmod DAC () BW: the Zmod DAC () samples at
100MSPS, which removes the 50MHz spectral component and attenuates the nearby frequencies.
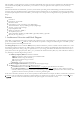
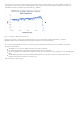
To trace the analog bandwidth of the DAC () and output stage beyond the theoretical limit of f /2= 50MHz, the following
experiment was performed:
The AWG was set to generate a 2MHz rectangular signal, 100mV amplitude;
the theoretical amplitudes of the fundamental and first 69 harmonics was computed;
the actual amplitudes of the fundamental and first 69 harmonics were measured with a high sampling rate scope (10GSPS, 2GHz
BW);
the dB difference between the theoretical and measured amplitudes was plotted. This represents an approximation of the
frequency characteristic of the DAC () and output stage.
The characteristic is shown in
Fig. 8.
SAMPLE