
Inc Sound Module Decoder - Manual

© 2017 Digitrax, Inc.
www.digitrax.com- 41 -
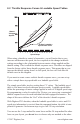
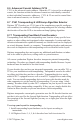
8.2 Throttle Response Curves & Loadable Speed Tables
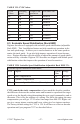
0 2 4 6 8 10 12 14 16 18 20 22 24 26 28
25%
50%
75%
100%
Motor
Voltage
Applied
Speed Steps
THROTTLE RESPONSE CURVE
Default Curve
V-start, V-mid, V-max 3 Step Table Curve
28 Step Loadable
Speed Table Curve
When using a throttle to control a locomotive, you will notice that as you
increase and decrease the speed, the loco responds to the change in throttle
settings according to the relationship between motor voltage applied and the
throttle setting. This is called the throttle response curve. Decoders are shipped
from the factory with a linear throttle response curve. This means that as you
increase the throttle setting from 0 to full speed, the loco will look like the
default curve in this diagram.
If you want to create a more realistic throttle response curve, you can set up
either a simple three step speed table or a loadable speed table.
The simple speed table involves setting three CV values. The loadable speed
table is a bit more involved with more precise results. Loadable speed tables
define the percentage of motor voltage applied at each of 28 digital speed steps.
By programming a value for each of the 28 steps, you can set up a customized
throttle response curve for each individual decoder equipped locomotive. The
shape of this curve defines the “feel” of the decoder’s throttle response.
With Digitrax FX
3
decoders, when the loadable speed table is active and 128
speed step information is received from the command station, the table is inter-
polated to generate 4 in-between steps to give full 128 step resolution.
You can use the 3 step method for some locos and the 28 step method for other
locos on your layout, you do not have to choose only one method or the other.