. ABOUT THIS GUIDE This guide is intended for users with varying levels of knowledge and experience of the Domotz Pro system: Custom integrators (Audio/Video, Home Automation, Security Systems, Digital Signage, etc) IT Managed Services Providers IT Technical Support Staff Enterprise IT Management Basic knowledge of computer networks and systems is required to fully understand the concepts and guidelines explained in this guide.
1 2. INTRODUCING THE DOMOTZ PRO SYSTEM Domotz Pro is a network monitoring and remote technical support system that gives its users full control over their networks. Domotz detects and monitors IP devices on the network, where the Agent is installed on, regardless of its brand or manufacturer, giving remote access to devices, network health analysis tools and the ability to get notified in the event of devices’ connectivity changes.
1 2.2. Key Features Automated Network Discovery and Monitoring: Domotz discovers and monitors all IP connected devices regardless of brand or manufacturer. Standard monitoring is restricted to subnets not exceeding /22. Multiple VLANs are supported with specific configuration. For Advanced Plan subscribers, external Private Layer 3 subnets (max /24 subnet mask) and external Public IP/Hostname are allowed.
1 2.3. The Agent To monitor and manage a network, Domotz needs a device running on the network 24/7. We call these “Domotz Agents”. You can install a software Agent on hardware you may already own or you can purchase turnkey hardware. Option A: Install Software The Domotz Portal contains all the links to install software on several different hardware platforms, including Raspberry Pi, Synology, QNAP, ReadyNAS, any Linux Debianlike server or Ubuntu Core platforms.
1 3.
1 3.1.
1 Make sure you have an account: • You can create an account at: https://portal.domotz.com/login. If you don’t know your username, check with the person that manages your company’s Domotz account. You will need to be listed as a member of your company’s team. New team members can be added in the portal at: https://portal.domotz.com/ Check your billing info: Please refer to @2.1. Account billing type to understand which account billing type you have.
1 3.2. Installing on Other Supported Platforms Domotz Agent is available, for free, on a number of platforms, such as: • • • • • • • Windows PC/Server Ubuntu 16.04 or higher QNAP NAS Synology NAS ReadyNAS Raspberry PI for selfinstallation Virtual Machine / Virtual Server Note: Installing the Agent on platforms other than the Domotz Box is not recommended for professional monitoring because OS changes in thirdparty platforms may introduce incompatibilities.
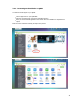
1 3.2.1. Domotz Agent Installation on QNAP To install the Domotz Agent on your QNAP: Visit the App Center on your QNAP NAS. Search for the Domotz app in the Home Automation Section. Once you find the Domotz application click “Install”. Once the installation is completed click “Open” Below are some screenshots outlining the steps in the process.
1 3.2.1.1. QNAP first time setup The next step is to configure your Domotz Agent. By clicking Open on the first time you will be brought to the Domotz Agent activation page. If you already have a Domotz account, you can login straight away. Otherwise you can create a domotz account signing up from here (please make sure you specify the right Country): Once logged in you can finally activate your agent, with the following steps: 1. Assign a name to the Agent 2.
1 Once this has done , the Domotz Agent will proceed scanning your network for devices. This will take anything from a few minutes up to 15 minutes depending on how many devices you have on your network. At this point you can download the mobile app (if you do not have already) and open it. PLEASE NOTE: By pressing “Done” you will enter the local Domotz Agent Web UI. This is not the main Domotz app, that is accessibile from mobile apps and our website.
1 3.2.2. Domotz Agent Installation on Synology To install the Domotz Agent on your Synology: 1. Visit the App Center on your Synology NAS. 2. Search for the Domotz app. 3. Once you find the Domotz application click “Install”. Once the installation is completed click “Open” Below are some screenshots outlining the steps in the process.
1 3.2.2.1. Synology first time setup The next step is to configure your Domotz Agent. By clicking Open on for the first time you will be brought to to the Domotz Agent activation page. NOTE: If you can't see the Domotz Hub app don't worry. If the Domotz Package is in Running mode, please connect to port 3000 of your NAS with a web browser, like this: :3000 and you'll be inside the Domotz Agent login page.
1 Once this has done , the Domotz Agent will proceed to scanning your network for devices. This will take anything from a few minutes up to 15 minutes depending on how many devices you have on your network. At this point you can download the mobile app (if you do not have already) and open it.
1 PLEASE NOTE: By pressing “Done” you will enter the local Domotz Agent Web UI, This is not the main Domotz app, that is accessibile from mobile apps and our website. The local Agent Web UI is only meant to provide a small subset of the Domotz features (Agent info, Network Info, Route Analsis, Speed Test) 3.2.3. Domotz Agent Installation on RASPBERRY PI 3.2.3.1. Getting started This section contains a few tips and tricks on how to get started with the Domotz Agent on your Raspberry Pi.
1 3.2.3.2. Installing Raspbian Installing the Domotz agent on your Raspberry Pi is a a lot more involved than installing it on a NAS, due to the fact that the Raspberry Pi needs to have an OS installed on it. First, there are some pre requisites and we’ll take you through everything you need here if you’re starting from scratch. In addition to your Raspberry Pi board you’ll need a micro SD card onto which you need to install an operating system.
1 3.2.3.3. Installing the Domotz Agent You’re now at the point where you need to download and install the Domotz Agent on your Raspberry Pi. 1. Make sure your Raspberry Pi is connected to the internet. We recommend to use a network cable and connect your Raspberry Pi directly to your router. 2. Download the latest Domotz Agent for Raspberry Pi If you uses the built in web browser in Raspbian, go to the Domotz Community to download the latest Domotz Agent.
1 3.2.3.4. First time setup The next step is to configure your Domotz Agent. To do so, make sure you’ve downloaded an installed the Domotz App on your mobile device. Then simply tap on the drawer menu button and tap on “Find New Agents” towards the bottom of the menu. This will automatically detect any new Domotz Agents on your network, as long as your mobile device is connected to the same network as your Domotz Agent.
1 1
1 Once you’ve created your account, the Domotz Agent will proceed to scanning your network for devices. This will take anything from a few minutes up to 15 minutes depending on how many devices you have on your network.
1 1
1 This also means that it’ll take some time before all of your devices appears in the Domotz App on your smartphone or tablet. Once the scan has finished, click/tap Done to continue the to the Domotz Agent web UI. Note that the setup of the Domotz Agent will fail if the time and date isn’t set correctly on your Raspberry Pi. To fix this, simply update the time and date on your Raspberry Pi and you’ll be able to proceed with the setup.
1 4. DOMOTZ APPLICATION REFERENCE 4.1. The Multisite Dashboard The multisite dashboard is designed with simplicity in mind. It contains a map and a list of all the Agents associated to the account. On this page you can quickly sort, filter and visualize multiple sites and go to the Agent you wish to interact with. The location of an Agent on the map is based on the address provided in the Customer Management tile (see section @4.8. Customer Management ).
1 4.1.1.
1 1
1 Available Credits – Shows how many credits are in your account (Not present if you are a new user with Subscriptions) Account Alerts You are able to turn of all alerts for your account so you will no longer receive push alerts or emails for any Domotz Agents that you are monitoring.
1 Collaborations – Number of collaboration requests that have not been accepted yet: 1
1 Expired – Shows all Domotz Agents installed from this account that are expired: 1
1 My Domotz Eyes configured – Details on the Agents having Eyes configured as well as the devices being montitored with the mean of Eyes: 1
1
4.2.
The Agent site dashboard currently contains tiles for quick access and some basic information under each one. Important devices: • Shows the status of the important devices and highlights if any of them is offline. • Selecting this tile takes you to a detailed list of all your important devices as well as all features explained in sections @4.3. Device List and @4.4.
Customer Management: • Shows the site details of the customer to whom this Agent belongs. More details can be found in section @4.8. Customer Management • Includes Client App tab to allow the user to activate and manage the Violet App. Described in separate document “Violet Digital Support Customer Facing App” Reports & Logging: • Displays last remote connections made to devices, power activities on devices, Notes added, and when Agent alerts are disabled/enabled.
4.3. Device List The device list is the typical entry point you access from the Agent Dashboard, when tapping on “Devices” or “Important Devices” tiles. Both tiles will bring you to different views of the device list page.
4.3.1. Device List Elements Each device in the device list has a more detailed page associated to it. In order to access its page, you simply need to tap on the device you wish to be redirected to.
The star symbol indicates that the device is on the “favourites” list The “port” symbol indicates that the device is connected to the network via LAN cable (if this detail is available) The “WiFi” symbol indicates that the device is connected to the network through a supported WiFi access point and provides a visual indication of the WiFi signal level (GreenYellowRed color code) The “Lock” symbol might indicates that the device offer additional capabilities through Domotz but credentials are require
Where available the Manufacturer’s symbol will be displayed next to the device name The Round Trip Delay is displayed like below. The value represents the last round trip delay from the device to the Domotz Agent. *Only available on the Web interface of Domtoz Pro.
4.3.2. Quick Filters The top menu bar, highlighted in red below, shows a number of filtering options allowing you to quickly access lists of devices sharing some characteristics.
4.3.3. Categories Tapping on the Categories option allows you to view different sets of devices: All = All devices are displayed Favorites = Only favorite devices will be displayed. In section 4.4.1.4 we explain how to set up a device as favorite. Favorites are local to the Mobile App or Web Browser. Important or Indifferent = These are devices that may or may not have an impact if one of them would go offline. In section 4.4.1.
4.3.6. Sorting and Grouping Sort by allows you to sort your devices by IP Address, Name, Status change and Status count. You can select to sort from lowest to highest value, or highest to lowest. Group by allows you to group your device by Make, Type, Category, Location, Zone or you can select No Group if you don’t want to group your devices.
4.3.7. Multiple Select This allows you to select multiple devices and edit the properties by clicking on the Pick an Action button.
4.3.8. Manage Devices or Subnets Within the devices list, the user is able to add nonIPconnected devices (“Dummy Device” not connected in anyway to the network) that can be connected to a PDU or smart outlet to enable simple, easy power management. Furthermore the user is able to configure the extended monitoring features including External hostname / IP and Private Subnet Scan.
By clicking on the “Manage Devices or Subnets” button, the user can chose one of the following options: Add a Dummy Device Add an External Hostname/IP Device* Configure an External Private Subnet to be scan* Information on how to configure VLAN support for Domotz Box Device blacklist (the ability to not monitor the particular device anymore) Device Auto Discovery (the ability to turn off Device Auto Discovery)
4.3.8.1. Add a dummy device (nonIP connected device) This feature allows to add a nonIPconnected device to a PDU or smart outlet to enable easy power management.
Some information are required to be added to the device: Name (mandatory) Type (mandatory, defaults to Generic) Location (optional) Zone (optional) The device won’t be monitored and the device detail view will only show the Info tab.
4.3.8.2. Add an external hostname/IP* External Hostname/IP monitoring allows to monitor virtual devices anywhere on the web, such as: A website An offsite server An external TCP service such as VoIP, FTP, etc. A maximum of 20 External IP device can be added. A valid IP or Hostname must be assigned to the device (mandatory), while Type and Name are optional.
Once added, the external Hotsname/IP is monitored like any other device (ping every 30 seconds).
4.3.8.3. Configurate an External Private Subnet Scan* With Private Subnet Scan it is possible to monitor up to 8 different Layer 3 subnets of a VPN connected LAN or other connected/routed subnets.
For each subnet the user must specify: Subnet name Network address (starting IP address of the subnet) Subnet mask Device monitoring includes: Network Status Tcp services available Remote connection Due to the limitation of Layer 3 information (MAC addresses are not propagated on top of this Layer), static IPs are recommended for devices to be monitored through this feature. * = Available on Advanced and Premium Plans only 4.3.8.4.
4.4. Device Details Once you tap on a device you enter the Device Details screen. This is the page where all the information and operations for a device are available. Starting at the top, we have three circles with key information: Status – shows if the device is online or offline IP Address – shows the IP address of the device Changes – shows how many status changes the device has had in the past 24h, i.e. how many times it’s gone offline/online over the past 24h.
There are five default tab screens available, Info, Connect, Alerts, History and Eyes and some other tab screens which vary depending on the type of device (for instance Config, for IPbased PDUs, smart plugs or supported Home Controllers, Interfaces for SNMPenabled Network Interface traffic and mappings and other devicespecific tabs).
4.4.1. Info The info view of a device allows you to do a lot of different things, from getting basic details about the device, to editing the device name and location, adding a note, selecting the type of device it is, etc. We’re going to cover most of the options in detail in this section and explain the functionality of every option.
4.4.1.1. Type To change the device type, simply tap anywhere inside the Type box.
On top most Common Types will be presented, scrolling down all types are shown grouped by Category (Audio&Video, Home&Office, Network, Smart Home, Mobile, Server, Engineering). To select the type you want to assign to your device, simply tap on one of the available types.
4.4.1.2. Name, Location, Zone To change the name of your device, simply tap anywhere in the Name box and you’ll get a field to enter the name of the device. The procedure is the same for entering the Location or Zone information.
Location is the room/site where the device is located and Zone is the area within the location (Rack, Floor #, etc.). These are all free text fields that also maintain a list of possible values so you don’t have to insert the same information multiple times.
4.4.1.3. Important/Different The Important/Indifferent option allows you to filter devices based on if they’re important or not for your company. For example, your NAS would potentially be a device that you would like to be sure is always online and therefore you could mark it to be Important, then by tapping on the categories button in the main menu in the Domotz app, you can easily filter for important devices only. Important/Indifferent this is a key concept within Domotz.
It’s very easy to configure the Important/Indifferent status of a device. Simply tap on either word to change the device from important to indifferent. In this example, the device is set to Important. For some device types (e.g. Network Equipment) the device is marked as Important by default. This capability and its behavior can be controlled and configured from the Portal, under the Account Settings section.
4.4.1.4. Add To Favorites You can add devices to your favorites list in order to have quick access if you want to be able to check in on them more often than the rest of your devices. To add a favorite, simply tap on the star in the Add to Favorites box and it’ll change from grey to yellow to indicate you made this device a favorite. Favorite is an information local to the user app. You may set different Favorites for the web app and others for the mobile app.
4.4.1.5. Delete Device This option allows you to delete a device as the name suggests. You would use this option to remove a device that isn’t likely to reappear on the network for whatever reason. In the screenshot below, we have a device that went offline 10 days ago and it should potentially be a prime candidate to be removed from your list of devices.
The delete of an offline device is a logical remove of the device from the view. If it reconnects to the network, it’ll appear again in the list of devices. This allows the user to be always fully informed of the real status of the network and any connected device. It is possible to remove ALL the offline devices in once, from the Offline tab “Remove all offline devices” button. You can also remove an online device.
4.4.1.6. Customizable Offline This allows you to determine how long a device must be unresponsive before being considered offline. Domotz checks for the status of all devices every 30 seconds and by default reports the device as offline if it has not responded for 2 minutes (10 minutes for mobile devices). For some devices this may be too frequent. If you would like to change this behaviour you can increase this up to a maximum of 24 hours.
Once you have changed the setting the Status line will now reflect the new frequency. Please note that there are 3 possible Status messages: Online Online – Unreachable: the device has not responded at the last status check but has not yet reached the new customized offline threshold. E.g.
4.4.1.7. Power on/off, power recycle & PoE Network switch mapping In case a device is connected to a PDU, a smart plug or a PoE network switch, additional elements are shown in the Info section.
4.4.1.8. Native Reboot buttons for supported devices For certain supported devices we also include a Reboot Now button which makes use of the native reboot software commands to the device itself. This button will be visible below the Status section as in the image below. For a complete list of supported devices, refer to the Community forum pages at http://community.domotz.
4.4.1.9. SNMP V2 Community strings Many features of Domotz are based on SNMP v2. In order to work, Domotz needs the communities for Read and Read/Write specified in this section to reflect the current settings of the device you are monitoring. Default values (public for Read and private for Read/Write) are preconfigured for all devices. Changing the values triggers the rediscovery of features based on SNMP values (e.g. Network Interfaces, OID based EYEs, etc).
4.4.1.10.
At the bottom of the Device Details, Domotz provides the support for Wake On LAN as well as other details. Wake On LAN button: sends immediately a Wake On Lan command to the device (only available if the device is offline) (*) Enable AutoWOL toggle: enable Automated Wake on LAN.
4.4.1.11. Response Time Delay* From the device info window you can see the last RTD value for the device, and the historical values. A new RTD value is presented every 30 minutes. If you want to disable the automatic ping requests from the devices to the Agent you can do it from the Manage Devices or Subnets (see @4.3.8.7. Device Ping RTD Settings* ) Clicking on the historical graph icon you'll see the history of values and the possibility to perform a ping command from the device to the Domotz Agent.
You also have the possibility to set an alert on the latest RDT value
4.4.2. Connect The Connect option allows you to connect to a device, with a single click. The currently supported options include: Embedded Remote Connection for Web Services (HTTP, HTTPS), Remote Desktop (RDP) , and Console Access (Telnet, SSH) Generic TCP Tunnel for remotely connect to virtually any single device through the mean of any TCP proprietary protocol.
4.4.2.1. Automatically discovered services The Domotz Agent automatically identifies whether a device is running any of the supported services (by checking on the most typical ports) and makes them available as clickable items as shown in the screenshot below.
4.4.2.2. Create/Remove Custom Connections The automated discovery only checks services on standard or typical ports. It is possible that on some devices, these services are installed on different ports. In this case, if you know the port, you can create up to 8 custom connections for each device by using the Create Custom Connection button. Custom connections feature a red “x” button allowing you to remove the connection.
4.4.2.3. Open a TCP Tunnel By specifying a port to be used, it is possible to create a generic TCP Tunnel and open a port for a 3rd party software connectivity to the device.
Once the TCP Tunnel is created and in place, you can use the endpoint Host and Port of the tunnel into your local 3rd party software to remotely connect to the end device. For security reason the Tunnel will be terminated in 1 hour since the creation. However, the connection can be closed at any time (“Close connection” button) and the configuration removed (click on the “X” on the TCP direct conection icon).
4.4.3. Alerts In the Alerts section of a device you can easily configure alerts for that device. There are three alert options for a device: Standard, Custom and No Alerts. By default, all devices are set to No Alerts.
4.4.3.1. Standard vs Custom Alerts Standard Alerts are particularly useful if you want to reuse the same set of alerts on a number of devices. In this case, you can select Standard, to have them applied to the device. Tap the Edit Standard Profile button in order to enter the Alert Configurator to visualise or modify your standard alerts. If you change the Standard Alerts, all devices configured with Standard Alerts will be affected.
4.4.3.3. Advanced Alerts* Advanced Alerts feature enables additional alerting options on your network devices and status. Be notified when your network performance decays or when one of your devices IP Address changes.
4.4.4. Config This tab screen is displayed for those device having special settings supported by Domotz. In particular, in this section you can find the place to configure and operate supported Power Distribution Units (PDUs) and IPcontrolled power outlets (smart plugs).
4.4.4.1. Smart Plugs & PDUs For a current list of supported PDUs and smart plugs, visit our Communities page at: http://community.domotz.com. You can also contact support@domotz.com if you have any questions or requests to support new devices. If a smart plug or PDU is supported by Domotz, the Config section is automatically displayed with an entry for each port of the device.
Here you have basic on/off control of the switch as well as a powercycle button (if natively supported by the PDU itself). You’ll be prompted to confirm that you want to change the power state of the switch each time. Domotz has an extremely useful feature where you can “Connect a Device/Connect additional devices” to the plug. What this does is that it creates a symbolic link between the outlet and the devices you selected, so you can easily keep track of what is plugged in where.
When the devices have been linked, you will be able to switch them on/off not only from the smart plug or PDU Config tab, but also from the linked device page. In the picture below you can see a QNAP NAS connected to a Digital Loggers PDU power switch. The on/off and reboot buttons also appear in the Info section of the QNAP NAS.
Please always make sure that the associated device of a PDU you have set up within Domotz matches the real wired configuration.
4.4.4.1.1. Username and password Our implementation of smart plugs and PDUs typically use the default username and password of the supported devices. This is normally tested by our Agent at discovery time. If default user and password are used, you are not asked to provide credentials.
The section can be unlocked by entering the correct device access credentials.
4.4.5. Eyes Domotz Eyes allow you to monitor services and other details on your network devices. Currently this includes: TCP Services SNMPv2 Sensors (via OID) Other monitoring services may be added in the future.
4.4.5.1. Configuring a Domotz Eye You will now see a new tab labelled Eyes. This is where you will configure the various TCP services or SNMP sensors. Please note that you can configure a maximum of 20 TCP services per device and unlimited SNMP sensors. The only limitation will depend on the plan you have subscribed to (see @5.2.2. Lite vs. Advanced vs. Premium ).
4.4.5.2.
To Add a new TCP service to monitor, enter the name of the service or TCP port number associated with it and the search box will return all available services that match the text entered:
Once the TCP service is added, the Domotz Agent will start monitoring that service.
4.4.5.3.
4.4.5.3.1. Determine OID It is very helpful to use an MIB Browser iReader like the following:http://ireasoning.com/mibbrowser.shtml – free version for end users). Using this tool it is possible to navigate the OID tree for devices that support SNMP to find the OID sensor that you want to monitor. It is important to configure your MIB tool for SNMP version 2c The following is an example of a Sensor that will allow you to monitor the level of black ink level of my printer.
2. From the OID of the SuppliesMaxCapacity (in my case 1.3.6.1.2.1.43.11.1.1.8.1.4): you get 2500. This is the MAX value of the black toner that is supported by my printer. I will need this later to set up the alert. 3. Then you can get the the OID of the SuppliesLevel (the OID for the Black cartridge in the example is 1.3.6.1.2.1.43.11.1.1.9.1.4) This OID is what you will add to Domotz and will begin to monitor from the Eye tab of the device (1.3.6.1.2.1.43.11.1.1.9.1.
You can refer to the manufacturer’s documentation to determine the correct OID and expected values
4.4.5.3.2. Configure SNMP Sensor in Domotz (using OID suggestions) In the Device Details screen go to the Eye tab and click on 'Add an SNMP Sensor': If Domotz has the selected device's OID information present in its database, you'll find a list of suggested OID when adding a new SNMP sensor as below. You can click on the '+' icon next to a specific OID to add that SNMP sensore to the device.
(throught discovered OID) In the Device Details screen go to the Eye tab and click on 'Add an SNMP Sensor'.
From this screen, you will need to add: Sensor Name Assign to category (for sorting purposes): Insert OID Define output type of Sensor (String or Numeric)
Domotz will confirm that the OID is in the correct format but cannot check that the value entered is valid The type of value the OID will return must match the manufacturer documentation and is important for the types of Alerts you then wish to create based on this Sensor (see Setting @4.4.3. Alerts ). Once you have configured your Sensors you will see them listed with the value that the device is returning for that OID.
SNMP Sensors Name, Category and Type fields may be edited (clicking on pencil icon), but the OID cannot be changed. If SNMP data of the selected device are present in the system, the user is prompted with a window suggesting available OIDs configurable for that specific device. The user can accept the suggestion or edit it, modifying the proposed values. If any of the suggestions suits the user needs, he can proceed inserting his own sensors, through the procedure described above.
4.4.6. Interfaces For SNMP enabled devices with Network Interfaces, Domotz is able to display the status and traffic information of their interfaces. Traffic information is collected and stored, so that the user can see the historical data and monitor the interfaces.
4.4.6.1. Automatic Port Mapping For many managed switches, Domotz is able to automatically detect and associate the devices with the port to which they’re connected. Individual information for each port of the switch is displayed such as max throughput, current upload and download rate. For a complete list of supported devices, refer to the Community forum pages at http://community.domotz.com. 4.4.6.2.
4.4.6.2.1. Diagnostic and Port Details Window For every single switch interface port there is additional information which can be accessed by selecting the port name or icons on the left of the SNMP information list. A tap on a port name or icon or graph icon from the Interfaces list will open a more detailed information window regarding that port shown as a list of devices that are mapped to it.
Tab “Info” The port details window is a visual representation of the individual port the following information:
port maximum throughput port upload and download bandwidth consumtion PoE power consumption (if any) Additional information are provided in this visualization: Last Seen Status: shown only if the device is down.
On both tabs mapped device(s) are listed – device(s) have been automatically mapped to this port and have the following information Associated Name of the device (as shown in the Devices List) IP Address of the device
4.4.7. History The History tab displays how many times your device has connected to and disconnected from the network and at what time(s) it occurred. Domotz performs a connectivity check (heartbeat) and reports in this section when changes in connectivity have occurred. Some devices (e.g. mobile) can lose connectivity quite often during normal operation, so such details may not be relevant. For many other devices, History offers a useful snapshot of the recent history of the device.
4.4.8. Security Camera* The Security Camera Features is not available in the Lite Plan.
4.5. Network The network section includes a number of tools that help analyse the network to which the Agent is connected.
4.5.1. Info The Info tab displays handy information such as the public (Internetfacing) IP address, network gateway, DNS and DHCP server.
4.5.2. Route The Route Analysis allows you to send test packets to any Internet public server and measure packet loss in percentage, as well as roundtrip delays. This can be useful to understand where bottlenecks and issues reside in communicating with an external (or internal) target. For example, you can simply type in a website name or an IP address to start the analysis, then select if you want to send 10, 20 or 50 packets. We recommend starting with 10 packets.
You’ll see a graphical representation of the route, then once the test is finished, you’ll see how long it took and if there were any obvious issues within your LAN (before the Router), between the Router and the ISP cabinet or between ISP and the selected target. You can select “See raw data” to get a full breakdown of the entire route. To start a new test, simply select Done and you’ll return to a screen where you can enter a new URL or IP address.
4.5.3. Speed Test Domotz automatically executes a speed test between the Agent and the nearest test server every 6 hours.
4.5.4. Downtime The Downtime tab displays a log of the Agent’s connection status changes. Typically, this indicates when the the internet connection is available (Up) or not (Down). Note that what is actually tested is the connection between the Domotz Agent and the Domotz Cloud. If you disconnect the Domotz Agent then reconnect it, you should see a pair of “Connection Down” and “Connection Up” events.
4.6. Alert Manager The Alert Manager allows users to quickly visualise and configure the alerts you have set up across the monitored network. Alerts are managed at user level (with a few exceptions).
4.6.1.
If you ‘Mute’ the alerts for this agent, the MultiSite dashboard will display an icon next to the Agent name indicating that alerts are disabled (see Fulham and Kytes agents below):
If an Agent connection is lost, this can be for two reasons: The network’s Internet connectivity was lost The Domotz Agent itself has been disconnected from accessing internet
4.6.2. Explanation of Network Connection and Agent Status Managemen This section offers some background on how Domotz populates the Network Health Analysis > Downtime tab versus how Domotz triggers the “Agent Connection Lost” alert. The two features (Downtime tab and Agent Connection Lost alert) are similar in idea, but technically speaking they have been implemented in a very different way.
4.6.3. Device Alerts In this section you can set alerts for any device on your network. On the left is the device name or MAC address.
Custom – Device specific customized alerts Standard – the alert type that can be reused for more than one device No – Indicates that there is no alert associated to this device The buttons related to individual devices turn green or red depending on if they have been selected (Green for Custom and Standard, Red for No Alerts). The alerts are configured by tapping on either the standard gearbox icon or + button for the device you want to set up the alert to. This takes you to the Alert Configurator page.
4.6.3.1. Standard and Custom Alert Configurator This page is used to set up events and medium for different alerts. The Alert Configurator is also accessible from the individual device alert page (see section @4.4.3.
Configured standard alerts will be consistent among all devices using these Alerts whereas the Custom Alerts are unique to the device for which they have been configured. You can choose whether to receive mobile app push notifications, emails to the account associated with Domotz Pro, or both.
4.6.3.2. Setting an Event on a TCP Service The Custom Alerts tab allows you to configure Events for TCP Services as well as for SNMP Sensors. You can configure a maximum of 20 TCP services per device.
Select the service you wish to monitor by tapping on the + button next to it. You will then see it appear in the Events configured for that device. You can then select to receive notifications via mobile push notification or email. To remove monitoring of the service, click on the red X next to the port number.
Above: An example of TCP email alert.
4.6.3.3. Setting an Event on a SNMP Sensor To set an Event for an SNMP Sensor you should click on the “Configure an SNMP alert” button and you will get the following popup with a list of currently configured Sensors or the possibility to create a new sensor (will take you to the SNMP Configuration screen previously described): By selecting the Sensor you will be able to configure up to 3 Events per sensor. The type of alert will depend on whether the Sensor is a String or Numeric value.
Numeric:
You will then see the configured Alerts appear in your list of Custom Alerts configured for your account:
You can remove the Event by clicking on the red X or set the alert to be received via email or mobile push. Events cannot be edited. The Event formula will be shown below the alert name in the Alerts tab but you can only delete an Event. If you want to change the formula a new Custom Event will need to be created. Events are tied to the Agent and not the user, so if you add/remove an Events this will affect anyone who is monitoring this Agent as well. i.e.
Above: SNMP push Alert example 4.7. Collaboration* This feature is only available to the Team Master and delegated Team Members With the Collaboration feature the Agent owner (and any delegated Team Member) can grant network access to a trusted person, as long as this person has a Domotz account (each Agent can be shared with max 2 people). This should be used to share Agents outside of your organization. You can also create a Team of colleagues from the Domotz Portal (see @5.1. Team Management ).
4.7.1. Invite a Guest To give a trusted third party access to your Agent/network, simply tap on the Collaboration tile in the Agent Dashboard and you’ll see the following screen.
Tap on Invite a Collaborator:
Now simply fill in the persons email address (used as a Domotz Account) and tap on Send. You can only invite existing Domotz Account users. You’ll see a Pending notification until the other person has accepted the invite.
The person you’ve invited will receive an email informing them that you’ve shared access to your Domotz Agent and they’ll receive a notification in their app that they’ve been invited to access your Domotz Agent. Your Domotz Agent will show up in their app under Guest Agents and they can select it from the list of Agents and can access it just like any other Domotz Agent. When the guests accept the invitation, his status will change from Pending to Accepted.
4.7.2. Remove a Guest To revoke access, simply tap on the small red X by the persons email address and you’ll be asked if you want to remove the guest from your Agent.
Simply tap "Yes, Remove" and the person will have their access to your Agent revoked. An email will be automatically sent to inform the person that they can no longer access your Agent.
4.7.3. I am a Guest If I am a guest of somebody else’s Agent (I was invited and accepted), I can monitor that Agent just like any other Agent. In this case the Collaboration section will simply display the owner’s account, the Agent Name, and button to leave the collaboration.
The “Leave Agent” function is permanent and you will be unable to access the Agent any longer. The owner will need to invite you again to restart the collaboration.
4.8. Customer Management Contains key details about the customer site. This will be used as reference contact information for the location where the Agent is set.
The physical address specified here will be used in the Multisite Dashboard (see section @4.1. The Multisite Dashboard ) The Email address is required to enable the Violet Digital Support Client App. The Email address must be different from any email used to create Domotz Pro user accounts. This section also contains a Note field. This can be used to keep track of some notes strictly related to the specific Agent/Network.
4.8.1. Client App This is where you will enable the Violet Digital Support Client App for your customers and manage which devices you will allow them to see and which devices they can turn on/off or Internet block from Violet.
You can configure the visible, power controllable and blockable devices before inviting your customer into the Violed Digital Support App. Blocking feature is only available through Violet when the Domotz Agent is configured on a Domotz Box or on a Luxul Router. Devices discovered on the tagged VLANs configured on the Domotz Box cannot be blocked through Violet Digital Support App due to technical limitation to the implementation of the pausing functionality.
4.9. Reports and Logging In the Reports and Logging Tile there are three screens that give you important information regarding the Agent. First is the Logging tab that will show you the last user events on the platform which include: Remote connections created to devices on the platform (See section @3.2. Installing on Other Supported Platforms ) Enable/Disable of Agent alerts (see Alert Manager section @4.6.
4.10. Manufacturer Support In collaboration with hardware manufacturers, Domotz has introduced the possibility to grant access to your Domotz Agent directly to a partnered manufacturer’s support team via the Manufacturer Support Tile. This tile is only available if you have devices on your platform that are supported by our partner manufacturers.
The first screen will contain a list of partner manufacturers that are available to support your devices. The second is the message that you will receive when you enable the access. Please note that this access will expire 3 hours after it is granted so you should contact the Manufacturer’s support team before activating it.
5. USER PORTAL AND ADMINISTRATIVE FEATURES The Domotz portal gives users all the available information and administrative features related to the account, associated Agents, licences and teams. The following sections are available: Web App: opens the Domotz web application.
5.1.1. Team Master A Team master is responsible for the administration multiple networks. He can: Use all features of domotz Buy and extend licences Create and remove team members Share an Agent with people external to the team (see section @4.7. Collaboration* ) 5.1.2. Team Members A Team member can access any Agent set up by the Team (either Team Master or other Team Members).
5.1.4. Configuring Team Members Team Masters (only) will have a Team section available in the user portal as shown in the screenshot below. You can add a new Team Member or Field Operator by clicking on the Add member button. The email address specified will receive an email with a link to finalize the Domotz account providing a new password. If you don't see the incoming email please check your spam folder, or delete the member and create it again.
5.2.1. Your Agents In this view you see a list of your current Agents including Version, Status and Expiration dates. In case you use Domotz Credits billing type (see @2.1. Account billing type ), you can also see how many credits you have available and can purchase more credits and extend Agent expiration date by clicking on Extend.
5.2.1.1. Credits History* *Only for users with Credits Account type (see @2.1.
5.2.2. Lite vs. Advanced vs. Premium All the basic features (e.g. device status monitoring, network monitoring, alerting, remote connections) are included in the Lite plan and available for all the configured agents. Some additional features (e.g. Extended Monitoring, Security Camera Integration etc) are optional and included in superior plans as follows. Domotz users can now upgrade to superior plans, in order to have more features.
The differencies between plans are connected with: The Lite Plan includes up to 300MB/month of traffic while connected to a remote device using a custom remote connection (HTTP,HTTPS,SSH,Telnet,RDP). If you need more bandwidth per month, you have to upgrade to a larger plan. The Advanced Plan includes up to 1GB/month of traffic during remote connections. The Premium Plan includes up to 10GB/month of traffic during remote connections.
5.2.3.1. Extend Agent If you use subscription billing type (see @2.1. Account billing type ), Domotz will bill automatically every month, using a valid credit card, based on the number of installed Domotz Agents. In case you use Credits billing type (see @2.1. Account billing type ) you can decide how long to extend your expiration date up to a maximum of 36 months. The credits required will be deducted from the total number of available credits.
5.2.3.2. Redeem Credits* *Only for users with Credits Account type (see @2.1. Account billing type ) You can also decide to shorten the expiration date and return the unused credits back to your account. This is done by clicking on the Shorten expiration date link in the Edit screen for the Agent. This will remove all credits and the new expiration date will be when the current credit is scheduled to expire.
5.2.3.3. Edit Agent In this section there are additional information about the selected Agent such as activation date, package version, local IP address, MAC address of the physical device binded to the Agent. Agent’s name can be changed from this section. 5.2.3.4. Delete Agent From the Edit section you can also delete the Agent from your list. Delete Agent will remove all the data related to an Agent. It can be useful if you want to move a box from a location to another, to get rid of previous data.
5.2.3.5. Clenaup Agent Data From the Edit section you can also Cleanup the Agent data. All the configuration made inside the Agent, together will the scanned info will be deleted. The Agent name and subscription status will remain as it is. 5.3. Get Domotz Hardware If you'd like to install the Domotz Agent on a NAS, Raspberry Pi or Linux Debian, there is a link to the Domotz Software page inside portal.domotz.com.
5.4.1. Account Info In this section, you can configure your billing account details (invoice address, type of account, name, country, etc). In case you use Subscription billing type (see @2.1. Account billing type ), you must also fill your payment method information.
5.4.1.1. Invoice information* *Only for Subscription Account billing type (check @2.1. Account billing type ). Once you've specified payment method, you will be able to control the Invoices information. It includes Invoices History with their dates and payments values. You can easily download any Invoice in PDF. There you can also find Estimated Upcoming Invoice information about the next payment. If you click on ?, you will see its details with Subtotal, date and the Plan you use.
5.4.2.
5.4.3. Settings This tab allows you to configure the default behavior of the Domotz agents (this settings will be applied to all your agents).
5.4.3.1. Daily Alert Digest This section allows you to configure the Alert Digest feature, which will collect notifications and alerts and send them in an email. Daily Alert Digests can be configured one of two ways: One time per Day: All email alerts currently sent in realtime, will be sent in a summary email once a day. Time Window: All notifications and alerts retrieved during the configured time are collected and sent at the end of the time window.
5.4.3.2. Important Device Classification The following accountwide options are available and will apply to all account Agents: Disabled: Installer must manually assign devices as Important or not. By default all devices will be assigned ‘Indifferent’ Always use Domotz Classification: Domotz will always assign network newly discovered devices like routers, switches, etc.
5.4.3.3. DTools Save time and effort by importing your DTools project for fast setup and configuration of the Domotz Agent. The DTools tile will appear in your Agents dashboard after Domotz Pro app restart.
5.4.4. TwoFactor Authentication This tab allows you to configure TwoFactor Authentication to add more security to your Domotz account When enabling the 2FA – via toggle button – the user is requested to enter his password and confirm.
After this step, the 2FA token (QR Code) is generated and needs to be saved and used inside an external application like Google Authenticator or Microsoft Authenticator to generate fresh Domotz login codes. While acknowledging the token saving, the user can chose to flag the option “Remember me”, which allows to trust the device and skip the authentication.
At the 2FA activation process completion, the page displays: The list of Trusted devices (all devices that do not require the twostep authentication at login moment, if the “Remember me“ option has been selected). By clicking the bin icon, the user can remove one device from the list. The code being used The button to renew the security token (the previous token will be disabled and the user will be prompted to insert a new code).
The user can disable the 2FA at any time (by using the toggle button and inserting his password). The Team Masters can check wether or not, his team members have configured the 2FA for their accounts, in the Team section available in the user portal.
5.4.5. Domotz PRO Public API* The Domotz Pro Public API (RESTful) provides developers with an easy and comprehensive way to integrate third party applications. An application programming interface key (API Key) is the code required in your own application to execute RESTful API calls against the Domotz Cloud, allowing you to retrieve and manage your own account and your Domotz Agents. You will need at least one API Key to access to your data through the Domotz Pro Public API.
Now new API key is created! You can see its code and Endpoint. Don't forget to copy the API Key code and save it in a safe place, clicking on Copy. Please, note that after closing the popup you will not be able to do see the key anymore.
You will see the created API key and control the number of calls made duiring the last 24 hours. The total number of API calls which can be executed in 24 hours is a function on the number of configured Agents on the Advanced plan (or higher). For more details, visit the Portal under Account and API Key section. You can create multiple API keys if you need to. The API Key can be used to retrieve general information about all the configured Agents.
5.4.6. Utility Integration Within this section, it is possible to enable the DTools integration to import DTools project for fast setup and configuration of the Domotz Agent. As soon as DTools is activated, the DTools tile will appear in the Agents dashboard.
6. APPENDIX A DOMOTZ AGENT LOCAL SETTINGS The Domotz Agent has a builtin http service running on port 3000. You access the builtin service by visitinghttp://:3000 in your browser.
6.2.1. Switch Configuration The interface port of the switch which will be used to connect the Domotz Box/Pi, should be configured: in Access mode / Untagged for the main interface used by the Domotz Box/Pi to communicate with the gateway (e.g. eth0). in Trunk 802.1q mode / Tagged for the additional VLANs to be monitored (e.g. the eth0.10 used for lan 10) Please refer to your specific switch/model guide on how to configure Trunk 802.1q and Access mode (Untagged/Tagged) for the port.
6.2.2. Domotz Agent Configuration You can find all the necessary information for configuring the Domotz Box to monitor multiple VLANs or to configure the Domotz Box with a Static IP in the Network Info section of the http portal. Network Info: When you press the Edit button you will see: Switching the DHCP toggle to Off you will be allowed to specify Static IP and nonDHCP based subnet mask, Gateway and DNS servers.
For every VLAN that you want to add, you need to specify: the Identification number of the additional VLAN the Static IP address of the Nework Inteface of the Domotz Box on the additional VLAN the subnet mask on the additional VLAN Make sure that the IP Address on the additional VLAN is not in use, and it is not the *.*.*.0 of that subnet (e.g. do NOT use IP addresses like 172.16.10.0).
7. APPENDIX B ACCESSING THE DOMOTZ AGENT Normally, we do not give users the root password for accessing Domotz Agents. This is to ensure that the domotz agent behaviour is not altered. Normally, root access is not needed unless you need to make nonstandard configuration changes suggested by Domotz Support and following their instructions. For security reasons, the password is different for each Agent.