Technical Instruction Manual DORROUGH LOUDNESS MONITOR Model 40-A -22 -25 -18 -20 -14 -16 -4 -6 -8 -10 -12 -2 0 +2 NCE RANGE ERSISTE NORMAL P RMAL dB NO +4 +6 PEAK +8 +10 +12 +14 dB RANG E LOUDNESS MONITOR MODEL 40-A DORROUGH RELATIVE LOUDNESS TO PEAK MODULATION Model 40-B 1.6 -36 dB TION DU LA 5 % MO 4 2 3. 2.5 2 -34 -32 -30 -28 -26 6.
INTRODUCTION Today’s audio requires careful attention to precise level control. The consumer now has audio playback systems that stretch the limits of program dynamics. With all this new equipment, the modern listener is able to hear subtle differences in level and distortion within program material and make critical program choices based on the quality of sound.
Peak hold circuits have been suggested as a solution, but while holding a peak reading, they ignore any information that occurs during the decay time. An engineer must make an adjustment, then wait while the peak hold circuit decays to get an indication of the new setting. Obviously this method cannot be used because of the need to respond to program material in real time.
INSTALLATION To install your DORROUGH Loudness Monitor, perform the procedures described in the following sections. Unpacking Your DORROUGH Loudness Monitor was carefully packed at the factory. Take a moment to examine the unit for any signs of shipping damage. If damage is evident, retain the carton and notify the transit carrier and your local distributor about your claim.
...Continued from Page 3 In actual practice, a "B" Type meter is generally used as a discrete monitor to indicate either a left or right channel. However, for Sum and Difference monitoring, repeat steps 3 and 4 (previous page), and adjust each input level control for a -6 dB indication on the meter scale for an individual channel. This action will result in a proper sum of "0" on the "B" Type meter scale.
Mounting Considerations The DORROUGH Loudness Monitor is available with or without a case, and is manufactured in several versions to accommodate differing customer needs. For example, "A" Type models are the standard Loudness Monitors, while "B" Type models measure Relative Loudness to Peak Modulation (see front cover). Fig. 3 and Fig. 4 show the physical specifications for mounting one or two meters with their cases in a rack panel. Fig.
CUSTOMER'S PANEL MODEL 10-A(B) OPENING (single console or panel mount meter) 4.250 " 2.00 " 2.50 " (METER CLEARANCE BEHIND PANEL) (5.5 " maximum depth) 5.000 " (METER CLEARANCE BEHIND PANEL) (a) Model 10-A(B) panel mount specifications. CUSTOMER'S PANEL MODEL 12-A(B) OPENING (dual console or panel mount meter) 8.562 " 2.00 " 2.50 " (METER CLEARANCE BEHIND PANEL) (5.5 " maximum depth) 8.750 " (METER CLEARANCE BEHIND PANEL) (b) Model 12-A(B) panel mount specifications.
CUSTOMER'S PANEL BEZEL 2 4 1 3 1 4 IR D EA PA "L 12 WINDOW 5 PCB MOUNT to 110 VAC METER ELECTRONICS AUDIO INPUTS +R +L GND -L +R 1. Install "jacking screws" into WINDOW so that tip of each screw is flush with far side of WINDOW. 2. Insert BEZEL through panel and hold in place by hand. 3. Slide WINDOW into BEZEL. 4. Center the WINDOW and turn the "jacking screws" clockwise, until BEZEL is pulled snug against the panel. 5. Secure the PCB mount to the WINDOW at outboard holes with four screws.
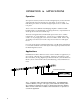
OPERATION & APPLICATIONS Operation Stereophonic material, in the form of left and right inputs, is fed to the meter at the terminal strip located in the rear of the meter, as shown in Fig. 1. Individual gain controls for the left and right inputs are also located on the rear panel. These sources feed a 20K balanced bridging amplifier. Unbalanced 10K bridging input is accomplished by converting the minus (-) input terminal to chassis ground on the rear terminal strip.
-14 -16 -18 -20 -22 -25 SIS AL PER dB -4 -6 -8 -10 -12 -2 0 +2 TENCE RANGE +4 NORMAL NORM +6 PEAK +8 +10 +12 +14 TRANSMITTER dB RANG E LOUDNESS MONITOR MODEL 40-A "A" TYPE ION 5 DU LAT % MO 4 3.2 2.5 2 1.6 -36 dB -30 -32 -34 -28 -26 6.3 8 10 12 16 20 25 -24 -22 -20 -18 -16 -14 -12 32 -10 % MODU LATION 40 50 63 80 -8 -6 -4 -2 100 MODULATION MONITOR 125 0 +1 +2 +3 dB MODEL 40-B RELATIVE LOUDNESS TO PEAK MODULATION "B" TYPE Fig. 8.
SUM -20 -22 -18 -14 -16 -25 SIS AL PER dB -10 -12 -8 -4 -6 -2 DIFFERENCE 0 TENCE RANGE +2 +4 +6 NORMAL NORM PEAK +8 +10 -25 dB -10 -8 TENCE RANGE -6 -4 -2 0 +2 +4 NORMAL NORM +6 PEAK +8 +10 + L - +12 +14 dB RANG E LOUDNESS MONITOR MODEL 40-A + R - SIS AL PER dB E -12 -14 -16 -18 -20 -22 +14 RANG LOUDNESS MONITOR STEREO FEED +12 MODEL 40-A + R - + L - + R + L - STL Fig. 11. Sum and Difference Monitors (2 Meters).
CIRCUIT THEORY The circuits that make up the DORROUGH Loudness Monitor (and Relative Loudness to Peak Modulation meter) are grouped onto two circuit boards: an Input Signal Processing Board (including Power Supply), and a Bar and Peak Driver Circuit Board. ☛ NOTE: On Panel Type Meters, the Power Supply is a separate circuit board. A block diagram, shown in Fig. 14, discloses the circuit elements and connections in a simplified form.
FIELD ALIGNMENT To occasionally check the accuracy of your DORROUGH Loudness Monitor, perform the Field Alignment listed in this section. Although the meter is designed for exceptionally stable performance, you may want to satisfy your curiosity or verify performance after a change has been made. All adjustments for the alignment of the LED display are located on the Input Signal Processing Board.
11. Decrease input signal to +13 dB ; observe that the +14 dB LED turns off. 12. Decrease input signal to +4 dB and adjust VR-13 for 0 dB on the scale. 13. Then, feed input signal of +4 dB to right input terminals, and adjust VR-14 for 0 dB on the scale. This duplicates the factory settings. 14. After both channels have been aligned, follow the procedure for settingup the operating level as described in the Initial Set-Up section (see Installation).
"B" Type Monitor Alignment Procedure 1. Connect the output from a test oscillator to the meter’s left input terminals (see Fig. 1 ). 2. Feed a 1000 Hz sine-wave, at a reference level of “0” dB, into the meter. 3. Adjust the left input gain control VR-13 so that DS-1 is off and DS-2, -3, -4 are on. 4. Adjust the input signal to -25 dB. 5. Adjust the low PERSISTENCE level control VR-44 so only the first LED (-36 dB on meter scale) at the bottom of the PERSISTENCE scale is illuminated. 6.
VR49 VR48 VR44 VR46 VR14 VR13 R VR49 VR48 VR44 VR46 VR14 VR13 L R L L+ L- R+ R+L POWER SUPPLY BOARD -L +R -R -15 +15 +5 INTERFACE BOARD (CUSTOMER'S POWER SUPPLY) VR49 VR48 R L VR44 VR46 VR14 VR13 R18 DS1 DS2 DS3 DS4 SIGNAL BOARD 0 dB (A) +5 dB (A) - 25 dB (A) -11 dB (B) -6 dB (B) - 36 dB (B) +14 dB (A) +3 dB (B) LED DRIVER BOARD Fig. 16. Simplified view of key alignment components on Model 10-A (10-B) circuit boards. Refer to Fig. 5 and Fig.
VR49 VR48 VR44 VR46 VR14 VR13 R VR49 VR48 VR44 VR46 VR14 VR13 L R +L -L +R -R +L -L L +R -R POWER SUPPLY BOARD VR49 VR48 R L VR44 VR46 VR14 VR13 VR49 VR48 R18 R L VR44 VR46 VR14 VR13 R18 DS1 DS1 DS2 DS2 DS3 DS3 DS4 DS4 2 SIGNAL BOARDS 0 dB (A) 0 dB (A) +5 dB (A) -11 dB (B) -6 dB (B) - 25 dB (A) +5 dB (A) -11 dB (B) -6 dB (B) - 36 dB (B) +14 dB (A) +3 dB (B) 2 LED DRIVER BOARDS Fig. 17. Simplified view of key alignment components on Model 12-A (12-B) circuit boards.
VR49 VR48 VR46 VR44 VR14 VR13 R +L -L +R L -R POWER SUPPLY BOARD DS1 DS2 DS3 DS4 VR49 VR48 VR46 VR44 VR14 VR13 R L SIGNAL BOARD -25 dB (A) 0 dB (A) +5 dB (A) +14 dB (A) -36 dB (B) -11 dB (B) -6 dB (B) +3 dB (B) LED DRIVER BOARD Fig. 18. Simplified view of key alignment components on horizontal Model 20-A (20-B) or vertical Model 21-A (20-B) circuit boards. Refer to Fig. 5 and Fig. 6 for specific panel mounting instructions.
NOTES 18