
User's Manual


12-18 TUV Draft Infinity CentralStation VF8
12: Recordings / Reports
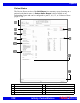
Graphical Trend Report
The Graphical Trend Report is a multi-parameter report containing up to 15 trended
parameters from bedside or telemetry patients. The report can be configured to print 2,
4, 8, 12, or 24 hours of Full or Event Disclosure data. The cursor time represents the
report ‘stop time’; the report ‘start time’ equals ‘stop time’ minus the report length.
You can customize the
trend selection per patient (page 12-25) or at system setup
(page 3-4). The trend scale can be a fixed scale or have autoscale values. When you
select
Enable Autoscale (page 12-25) in the Trend Order Setup screen, the low and
high scale values are determined by an autoscale factor to the highest and lowest
parameter value over the currently selected trend time. To request a Graphical Trend
Report, see page 12-23.
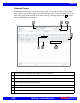
Selected Strip Report
The Selected Strip Report allows the user to select a waveform of interest within
Full Disclosure and define beginning and ending cursor times (not to exceed one
hour). The report can contain 8 seconds to 1 hour of information (8 second default)
with 8 seconds of waveform data per row. To request this report, see page 12-24.
Selected Events Report
The Selected Events Report may consist of up to six pages (4 event strips per page).
You can select and print the most recent 24 events. Each waveform contains 10
seconds of data, and is annotated with Lead Printed, Lead Processed, Event Cause, 12
of the most recent parameter values, Event End Time, and Event Date. If the lead
processed is stored in the Infinity CentralStation database, it will be printed on the
report. If not, the top lead of the displayed Full Disclosure data will appear.To request
this report, see page 12-24.
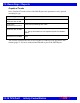
Parameter Autoscale Factor (approximate)
HR 10 bpm
PVC/min 10
% Paced 10%
SpO2 10%
PLS 10
ST 1.0 mm
0.10 mV
STVM
STCVM
Pressures (including NBP) 10 mmHg
1 kPa
All others 10
DRAFT