
Specifications


52
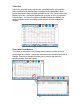
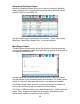
Event List
Presents a summary of all captured events in the order in which they
occurred. Each event entry contains the date and time when the event
was captured, the color coded channel/parameter of the captured event,
the event category and event classification. The event list can be filtered
by type and/or time.
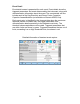
Once you bring up an event screen, the taskbar changes to show
specialized icons that provide easy access to view event display. These
icons are not common to all screens, only to event data screens.
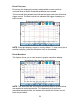
Trend Plot
Displays time plots or trend visualizations of journalled data.
Event List
Presents a summary of all captured events in the order that
they occurred.
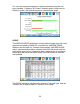
Event Plot (rms)
Shows the voltage and current rms plots recorded for the
event. Threshold values and event details can be displayed
using the corresponding function keys.
Event Waveform
Shows the voltage and current waveforms that were captured
with the event, based on user settings.