
User`s guide


7-11
CH 7/ View Event Data
View event
detail
(continued)
Action... Result...
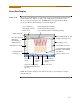
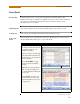
STEP 3: The magnify buttons
serve as zoom function keys, each
of which feature a plus sign or a
minus sign within.
• Press Zoom+ to display the
zoomed area and view the
event cycles in greater detail.
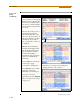
Users may repeatedly zoom in
on a plot for up to seven (7)
levels. To further zoom in on
an event cycle, simply repeat
the procedure on Step 2.
• Press Zoom-(n) to unzoom
cycles display one increment at
a time, where n is the counter
of how many times the event
cycles have been magnified.
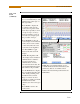
• Use Wave/RMS to toggle
between rms and waveform
display.
NOTE: Pressing Wave will
only display waveform data for
channels that are enabled to
record waveforms. For
channels that do not have
associated waveform data, the
screen will maintain the format,
but will leave the plot blank.
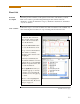
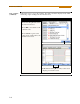
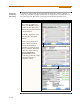
• Use the Text button to display
the event threshold values and
other details pertaining to the
disturbance that occurred.
Pages 7-12 and 7-13 show
examples of useful event detail
included in the textual
summary (for select event types
only).
• Press Back to return to the
event screen.
MARK510bpg
MARK519b
NOTE: The event textual summary is color
coded. Red indicates the threshold value(s) and
parameter(s) that are out of limits. Green
indicates the measurement parameters that are
within limits.