
User`s guide


7-18
Trend Display
Trend Display
What is
displayed on a
trend?
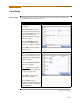
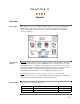
A trend consists of the timed and threshold waveforms for the parameter on display.
Users have the option to enable/disable a trend or plot display, wherein display area
will resize according to the number of plots enabled for display. In addition, users have
the option to enable/disable channels to trend in a select parameter. Each parameter can
have one or multiple channels to plot.
The trend screen also features a Zoom box, wherein users can expand or narrow the
size of a zoomed area via touch and drag. The zoom feature allows users to view trend
coordinates of min, max and avg values in greater detail.
Sample trend
screens
Sample screens below feature the same Voltage RMS parameter.
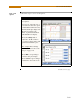
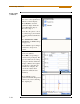
Example 1 - One Parameter, Multiple Channels plot: Voltage RMS parameter with
enabled channels A (in red), B (in yellow), and C (in blue). The plot below has been
zoomed in three times.
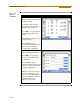
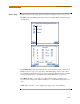
Example 2 - One Parameter, One Channel plot: Voltage RMS parameter with enabled
channel C (in blue). The plot below has been zoomed in five times.
trend of max values
trend of avg values
trend of min values
time and date when
event was captured
threshold values
(Hi limit, Low limit)
trigger parameter,
trigger channel
MARK443
MARK444