
User`s guide


8-19
CH 8/ Reports
Panel Operation
Annunciator
panel color
scheme
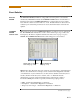
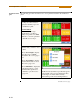
The annunciator panel displays metered data for the selected parameter. The metered
data is updated once per second. This is the same data that appears in the meter screen,
and used in calculating journals. If the selected parameter is not journalled, the rms
event or transient event count can be selected to appear in the panel instead of
journalled data.
Disabled parameters appear in gray. A panel is considered disabled if none of the limits
were set.
Enabled parameters, on the other hand, are color-coded. A panel is active while the
instrument is monitoring or by loading a previously saved file from the data card. An
active panel can have two or three states (Normal, Moderate, or Severe). When
monitoring, parameters that are within limits are shown in green (indicates Normal
state). Those that are moderately out of limits, exceeding the Low or High threshold
limits, are shown in yellow (indicates Moderate state). Parameters that are extremely
out of limits, exceeding the Very Low or Low threshold limits, are shown in blinking
red (indicates Severe state).
Annunciator
panel links
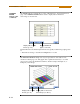
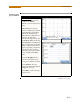
Users may choose to plot a parameter since the panel is linked to the plot screen.
Simply select the parameter if you want to view it in detail. Use View Graph to display
the parameter plot and use View Limits to view the parameter threshold values.
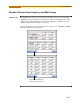
The properties of a panel can also be customized. Use Edit Panel to enable/disable
channels to plot.
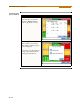
The next pages show how to view a parameter in detail using the annunciator panel.
The same procedure applies even when you select different journal categories to plot.