
User`s guide


1-16
Basic Operation, continued
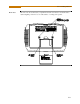
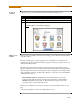
Home screen
icons
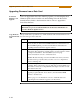
Home screen contains the following icons used to access various PowerVisa functions:
Scope - Scope mode shows real-time voltage and current waveforms of the signals on
the measuring inputs. See Chapter 3 View Real Time Data - Section A Scope Mode.
Meter - Meter mode displays voltage and current measurements, along with other
calculated parameters. See Chapter 3 View Real Time Data - Section B Meter Mode.
Harmonics - Harmonic screen displays a spectral graph and textual matrix featuring the
amplitude and phase of each voltage and current harmonic to the 63rd harmonic. See
Chapter 3 View Real Time Data - Section C Harmonics.
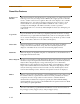
Phasor - Phasor diagrams indicate phase relations between voltage and current based
upon the angles of the fundamental. See Chapter 3 View Real Time Data - Section D
Voltage and Current Phasor.
Preferences - Users can set instrument preferences like time and date, threshold alarm
feedback, language selection, communications, LCD display, and data card operation.
See Chapter 4 Instrument Settings.
Events - Events result in a contiguous collection of cycles that is recorded into memory.
Events are classified according to IEEE 1159, IEC 61000-4-30 Class A, and EN50160
standards. Events are displayed only after monitoring has been turned on or upon
reading a stored file from the data card. See Chapter 7 View Event Data - Section A
Events.
Trend - Trend allows users to view plots of journalled data along with min/max
measurements over the interval. See Chapter 7 View Event Data - Section B Trend.
Reports - The PowerVisa allows users to view two types of reports on QOS
compliance. EN50160 reports show graphs and statistical tables reflecting the
compliance of parameters specified according to EN50160 standard. Status shows a
quick status summary of Standard PQ, EN50160, and Motor Quality parameters using
the annunciator panel. The color coded panel indicates whether or not a parameter is
within limits. See Chapter 8 Reports.
Start/Setup - Users have the option to use Automatic Setup and proceed directly with
data monitoring or they can configure the instrument step-by-step using the Wizard
Setup. Users can also do Advanced setups to modify trigger parameters and intervals or
tweak threshold settings under the Advanced Setup Options. See Chapter 5 Start Menu
and Chapter 6 Advanced Setup Options.