
User`s guide


3-12
Harmonic Detail
Harmonic Detail
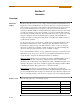
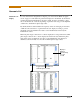
The PowerVisa allows users to determine the numbers or the range of harmonic
frequencies to trend. A blue box showing the default zoomed area appears once the
Detail button is pressed. Touch any side of the zoom box to activate the drag function.
Touch and drag the sides of the zoom box to expand or narrow in on a select number of
harmonic/interharmonic graphs. The zoom box moves horizontally only. The vertical
scale will autoscale when zoomed.
NOTE: To select whether the vertical is scaled to the fundamental or the greatest
harmonic, use the Options key (see page 3-13).
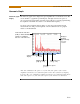
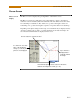
The magnify buttons serve as zoom function keys, each of which feature a plus sign or
a minus sign within. Press Zoom+ to display the zoomed area and view harmonic
graphs in greater detail. Users may repeatedly zoom in on a plot for up to seven (7)
levels. Press Zoom-(n) to unzoom graph display one increment at a time, where n is the
counter of how many times the harmonic graphs have been magnified.
touch and drag zoom box to
desired magnification scope
MARK235
MARK235b
MARK235c
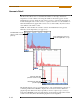
harmonic data plot
(shown in channel color)
interharmonic data plot
(shown in gray)
Fundamental exceeds
square so bar extends
past top