
User manual

Page 67
EA Elektro-Automatik GmbH
Helmholtzstr. 31-33 • 41747 Viersen
Germany
Fon: +49 2162 / 3785-0
Fax: +49 2162 / 16230
www.elektroautomatik.de
ea1974@elektroautomatik.de
PSI 9000 DT Series
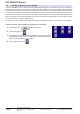
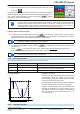
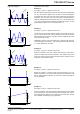
3.9.8 Trapezoidal function
Thefollowingparameterscanbeconguredforatrapezoidalcurvefunction:
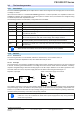
Value Range Description
I(A), U(A) 0...(Nominal value - (Off)) of U, I A = Amplitude of the signal to be generated
I(Off), U(Off) 0...(Nominal value - (A)) of U, I Off = Offset, based on the foot of the trapezium
t1 0.1 ms...36000 s Time for the positive slope of the trapezoidal wave signal.
t2 0.1 ms...36000 s Time for the top value of the trapezoidal wave signal.
t3 0.1 ms...36000 s Time for the negative slope of the trapezoidal wave signal.
t4 0.1 ms...36000 s Time for the base value (offset) of the trapezoidal wave signal
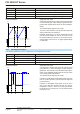
Schematic diagram: Application and result:
Offset
t
A
Amplitude
t1t2 t3 t4
Here a trapezoidal signal can be applied to a set value
of U or I. The slopes of the trapezium can be different
by setting different times for gain and decay.
The periodic duration and repetition frequency are the
result of four time elements. With suitable settings the
trapezium can be deformed to a triangular or rectangular
wave. It has, therefore, universal use.
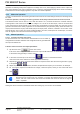
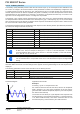
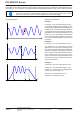
3.9.9 DIN 40839 function
ThisfunctionisbasedonthecurvedenedinDIN40839/ENISO7637(testimpulse4),andisonlyapplicable
to voltage. It shall replicate the progress of automobile battery voltage during engine starting. The curve is divided
into 5 sequences (see diagram below) which each have the same parameters. The standard values from the DIN
aresetalreadyasdefaultvaluesforthevesequences.
ThefollowingparameterscanbeconguredfortheDIN40839function:
Value Range Seq Description
Ustart 0...Nominal value of U 1-5 Start voltage of the ramp
Uend 0...Nominal value of U 1-5 End voltage of the ramp
Seq.time 0.1 ms...36000 s 1-5 Time of the ramp
Seq.cycles ∞or1...999 - Number of repetitions of the entire curve
Time t1 0.1 ms...36000 s - Time after cycle before repetition (cycle <> 1)
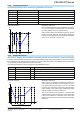
Schematic diagram: Application and result:
t
A
U start
1 2 3 4 5 t1
Sequences
The function is not suitable for standalone operation of a
power supply, but optimal for a power supply in conjunc-
tion with an electronic load,such as one from EL 9000
DT series. The load acts as a sink for the rapid fall of the
output voltage of the power supply enabling the output
voltage progress to follow the DIN curve.
The curve conforms to test impulse 4 of the DIN. With
suitable settings, other test impulses can be simulated.
If the curve in sequence 4 should be a sine wave, then
these 5 sequences have to be transferred to the arbitrary
generator.