
Cut Sheet


V8-T5-42 Volume 8—Sensing Solutions CA08100010E—July 2015 www.eaton.com
5
5
5
5
5
5
5
5
5
5
5
5
5
5
5
5
5
5
5
5
5
5
5
5
5
5
5
5
5
5
5.3
Photoelectric Sensors
IntelliView Series Sensors
Detection Diagrams
Foreground/Background Suppression Models
Models starting with E75-PPA_ or E76-PP1_
Black/White Difference
Distance Sensing Models (Rectangular Package Only)
Models E75-DST400A010-M12
Note
1
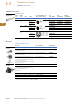
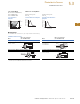
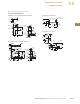
These diagrams depict the width of the sensing beam over distance. These diagrams also show the sensing
difference between white and gray targets. Because gray is less reflective than white, gray targets will
typically need to come closer to the beam centerpoint to be detected.
E75-PPA010P-M12
1
E75-PPA025P-M12
1
E75-PPA050P-M12
1
E75-PPA110P-M12
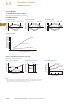
Analog Output Diagram Digital Output Diagram Black/White Difference
mm
cm
6
4
2
0
-2
-4
-6
0510
Distance
Gray R18% White R90%
Variance (mm)
Gray R18%
White R90%
mm
cm
6
4
2
0
-2
-4
-6
0 5 10 15 20 25 30
Distance
Variance (mm)
White R90%
Gray R18%
mm
cm
12
8
4
0
-4
-8
-12
010 2030405060 7080
Distance
Variance (mm)
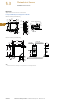
Background Suppression
Detection Area
Foreground Suppression
mm
mm
1100
1000
900
800
700
600
500
400
300
200
100
0
50 100 150 200
300 1000 2000 3000 4000
Distance (mm)
0
10
Analog Output (V)
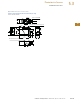
Measurement Field
Measured
Distance
Distance
0
24
Analog Output (V)
Congured
Switching
Distance
20 mm
5 mm
Hysteresis
300 1000 2000 3000 4000
Distance (mm)
0
40
50
30
20
10
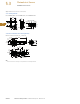
Difference (mm)
White 90%
Black 4%
White 90%
Gray 18%
White 90%