
Specifications

EAW Smaart 6 Operation Manual Smaart 6 Commands
103
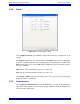
5.5 Keyboard Shortcuts
Ctrl/Cmd means press the Control (Ctrl) key if you are
using Windows, or the Command key (sometimes
referred to as the “Apple” or “Flower” key) on a Mac. Sim-
ilarly Alt/Opt refers to the Alt key on a Windows keyboard
or the Option Key on a Mac. Left-Click refers to a Win-
dows style two-button mouse and is equivalent to a regu-
lar mouse click on a Mac.
General Controls
Frequency Response Mode = F
IR Analysis = I
Spectrum Mode = S
Real-Time On/Off = O
Reseed Average Buffers = V
Cycle Z-order on Selected Graph = Z
Instantaneous = Cmd/Ctrl + I
High Contrast Colors = Alt/Opt + H
Help
Windows = F1
Mac = Cmd + Shift + ?
Generator Shortcuts
Generate Signal = G
Increase Signal Level = ]
Decrease Signal Level = [
Spectrum Display Frequency Scale
Narrowband = 5
1/24-Octave = 6
1/12-Octave = 7
1/6-Octave = 8
1/3-Octave = 9
Octave = 0
Delay Time
Auto-Locate Delay (Large) = L
Clear Delay (Reset to 0 ms) = F5
Recall Stored Delay Time Preset = A, B, C D, E
Increase Delay Time = . (Period key)
Decrease Delay Time = , (Comma key)
IR Analysis Window Only
Start/Stop Impulse Recorder = R
Assign Cursor Position to Current Delay Time = Shift +
Space Bar
Assign Locked Cursor to Delay Preset = Cmd/Ctrl + A, B,
C, D, E
Save Impulse Response = Cmd/Ctrl + S
Range, Scale, and Zoom Shortcuts
Amplitude/Magnitude (y-axis) Range
Zoom Selected Graph In (vertically) = +/=
Zoom Selected Graph Out = –
Move Selected Graph Up = PageUp
Move Selected Graph Down = PageDown
Frequency/Time (x-axis) Range
Zoom Selected Graph In = Up Arrow (S)
Zoom Selected Graph Out = Down Arrow (T)
Move Selected Graph Left = Left Arrow (W)
Move Selected Graph Right = Right Arrow (X)
Phase Display
Set Phase Range to:
• 180° to –180° = Alt/Opt + Home
• 0° to 360° = Alt/Opt + End
Frequency Zooms (Preset Frequency Ranges)
Recall Zoom 1 = 1
Recall Zoom 2 = 2
Recall Zoom 3 = 3
Recall Zoom 4 = 4
Configure Frequency Zooms = Alt/Opt + Z
Mouse Zooming
• Left-Click and drag on plot to select zoom range
• Release mouse button to set range
• Click in margin of graph to reset range
Trace Shortcuts
Shift Front Trace Up (on selected graph) = Cmd/Ctrl + Up
Arrow (S)
Shift Front Trace Down (on selected graph) = Cmd/Ctrl +
Down Arrow (T)
Capture Reference Trace = Space Bar
Show Legend = Alt/Opt + L
Delete Selected Reference Trace (Legend dialog only) = Del
Locked Cursor Shortcuts
Set at mouse cursor position = Cmd/Ctrl + Left-Click on plot
Show Harmonics (on/even/odd/all/off) = H
Set at lowest point on the front trace = Shift + L
Set at highest peak on the front trace = Shift + P
Track Peak (on real-time displays) = Cmd/Ctrl + Shift + P
Remove Locked Cursor = Cmd/Ctrl + X