
Specifications


EAW Smaart 6 Operation Manual Concepts, Glossary, and Bibliography
26
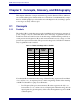
2.1.5 Frequency Resolution
The frequency resolution (Q) of an FFT is equal to the sampling rate divided by the FFT
size. The frequency data points in an FFT are distributed linearly along the frequency
axis at intervals of Q Hz, from 0 to the Nyquist Frequency (1/2 the sampling rate). For
example, with a sampling rate of 44.1 kHz, an FFT size of 4096 (4 k) yields a frequency
resolution of 10.77 Hz. The resulting FFT has a data point every 10.77 Hz, 0-22.05 kHz.
Fixed-Point Per Octave (FPPO) Frequency Response Display
One problem associated with the linear distribution of FFT data points arises from the
fact that we hear frequencies logarithmically. Human hearing perceives each doubling
of frequency as an equal interval so each higher octave contains twice as many frequencies
as the one below. Using the example discussed on the previous page, in an FFT with a
frequency resolution of 10.77 Hz, there will be only three data points in the range 31.5-
63 Hz (the center frequencies of the two lowest octaves), providing very poor resolu-
tion. In the two highest octaves, the span between the center frequencies (8-16 kHz) is
8 kHz, yielding more than 700 data points. When viewed using a logarithmic frequency
scale, these data points are densely packed, creating a very difficult display to interpret.
Smaart 6 addresses this problem by using multiple FFTs, at different sampling rates and
FFT sizes, then combining the results to provide equal resolution in every octave, except
the two lowest. The resolution of the Real-time mode display is 24 points per octave
above 44 Hz, with 24 points distributed over the two lowest octaves. Note that using
multiple FFTs results in a longer time window at lower frequencies and a shorter time
window at higher frequencies.
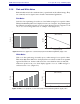
Frequency Resolution and Octave/Fractional Octave Band Displays
For Spectrum measurements, the multiple-FFT technique used to measure Frequency
Response is not an option due to a mathematical limitation and so all RTA displays are
created from single FFTs. Since the linear distribution of FFT points in a single FFT
yields lower resolution in the lower than higher octaves, there may be bands at the low end
that contain only 0 or 1 data point, depending on the display and FFT input parameters.
The wider spacing between FFT data points in the lower octaves accounts for the missing
teeth seen at the low end in banded displays on some FFT-based analyzers. Smaart uses
an advanced algorithm to properly distribute energy into bands at low frequencies but
very sparse FFT data limits its effectiveness. Therefore, it is still advisable to select FFT
parameters that provide good frequency resolution at the lowest frequencies required.