
Specifications

EAW Smaart 6 Operation Manual Analysis Modes and Display Types
41
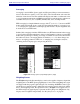
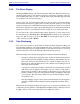
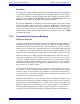
Figure 3-4 Spectrograph dB Range
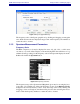
The frequency scale of the Spectrograph is set by clicking and dragging a rectangular
area, which becomes the new displayed range. Click on the frequency axis numbers to
return the scale to normal.
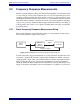
3.1.3 Spectrum Measurement Parameters
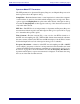
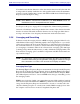
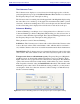
Frequency Scale
The RTA’s frequency scale may be displayed in octave, 1/3-, 1/6-, 1/12-, or 1/24-octave
resolution or as a narrowband display of the underlying FFT data with linear or log-
arithmic (Lin/Log) scaling. Set the frequency scale for the Spectrum displays from the
Scale control under the Spectrum button.
Figure 3-5 Frequency Scale list
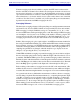
The frequency range of the Spectrum and Magnitude plots may be set using hot keys
(page 103) or by recalling one of the four Frequency Zooms (set in Options
-
>Zoom)
assigned to the 1-4 keyboard keys. The x- and y-axis range can be set by clicking and
dragging to draw a rectangle around the desired plot area, then releasing the mouse
button. Click the frequency numbers to return the scale to normal.