
Specifications

EAW Smaart 6 Operation Manual Analysis Modes and Display Types
45
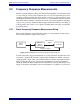
3.2.2 Frequency Response Overview
In Frequency Response measurements, Smaart 6 compares the reference and measure-
ment input signals in real time to find their relative magnitude and phase differences,
frequency by frequency. The mathematical technique used to compare the two signals
is called a transfer function.
Because the transfer function works by comparing two input signals, any delay between
the two signals must be compensated for to obtain a valid measurement. This can be
accomplished using Smaart 6’s delay locator and internal delay. Nonlinear signal
processing devices, such as limiters and compressors, should not be used when per-
forming Impulse Response and Frequency Response measurements (see Coherence
Overview on page 49).
3.2.3 The Magnitude Display
Magnitude, the default Frequency Response display, plots magnitude on the y-axis with
0 dB in the center and positive and negative dB values above and below the zero line,
respectively. The x-axis of the plot shows frequency and is normally displayed in log-
arithmic scaling with grid lines at octave intervals. On the standard magnitude display,
a value of 0 dB for a given frequency data point represents an equal amount of energy
(i.e., a relative difference of zero) in both the reference and measurement signals at that
frequency. A positive or negative dB value for a given frequency indicates more or less
energy in the measurement signal relative to the reference signal at that frequency.
The default Magnitude trace has 24 data points per octave, although with 44.1/48 kHz
sampling rates, the two lowest octaves have a total of 24 points. For a sampling rate
of 96 kHz, the first 24 data points are distributed across the three lowest octaves and
there is an additional octave of data on the high end. This equal resolution per octave is
achieved by combining the results of multiple FFT calculations for each display update.
The fixed-point-per-octave (FPPO) display tends to be easier to read, particularly at
higher frequencies, than traces based on one fixed FFT size, due to the linear frequency
distribution of FFT bins.