
Specifications

EAW Smaart 6 Operation Manual Analysis Modes and Display Types
46
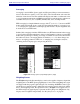
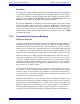
3.2.4 The Phase Display
Clicking the Phase display button shows the phase shift t(ime difference) in the mea-
surement signal relative to the reference signal across frequency. All phase values are
plotted within a 360° range of +180° to -180° (0° in the center). This 360° range represents
one complete cycle at a given frequency.
A phase value of 0° (no relative phase shift) for a given frequency point means that the
measurement and reference signals arrive at exactly the same point in a cycle at that
frequency. Frequencies at which the measurement signal arrives earlier in a cycle than
the reference signal show a negative phase shift. Frequencies at which the measurement
signal arrives later in a cycle than the reference signal show a positive phase shift.
To move the 0° line on the standard wrapped phase display up or down on the plot in
45° increments, press Alt + Page Up or Alt + Page Down, respectively. To set the phase
range to 0°-360° (bottom to top), press Alt + End. To reset the phase range to +180° to
–180° (default), press Alt + Home.
3.2.5 Time Windowing
Time windowing can remove questionable or unwanted data from Frequency Response
measurements and helps to smooth and stabilize data traces. Typical uses for this feature
include isolating the response of high frequency components and windowing out strong
reflections that may cause comb filtering at the measurement position.
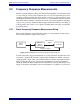
Time windowing uses both time and frequency domain measurement techniques:
• Frequency-domain data is transformed into its time-domain representation by
an inverse Fourier transform (IFT), resulting in a time-domain impulse response.
This is the same procedure Smaart 6 uses to obtain an impulse response in
Impulse mode using the Delay Auto-Locator feature but everything is done in
the background in real time.
• A special flat top data window function with a time constant twice the specified
time window size is applied to the impulse response, centered on the peak of
the first arrival (actually on the beginning of the impulse response time record
but this normally corresponds to the peak arrival time, assuming the delay time
is set properly). The data window function forces unwanted samples outside
the window to zero.
• The edited impulse response data is then transformed back into the frequency
domain by an FFT and the resulting frequency magnitude and phase data is
plotted.
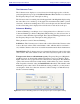
The time windowed Frequency Response appears as a second trace in a different color
(a light blue green by default) on the Magnitude and Phase displays. This trace may be
brought to the top of the z-axis stack and saved as a Reference Trace.