
Specifications

EAW Smaart 6 Operation Manual Analysis Modes and Display Types
49
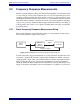
Smoothing
Smoothing, an averaging technique available only for Frequency Response measurements,
can reduce the jaggedness of the Magnitude trace, making trends in the system response
easier to see. Smoothing averages each data point with a number of adjacent points on
either side of it determined by the Smooth setting below the Freq. Resp. button. The
Smooth settings available from the drop-list are none, 3, 5, 7, 9.
For example, if Smooth = 3, each data point represents the value of that point averaged
with the next higher and next lower points on the trace. If Smooth = 5, each data point
represents the value of that point averaged with the two higher and two lower points on
the trace. In other words, you are averaging across frequencies, effectively increasing
the bandwidth of each frequency data point rather than over time as in the case of RMS
and Vector averaging.
3.2.7 Coherence and Coherence Blanking
Coherence Overview
Coherence is an indication of the linearity between two signals in a Frequency Response
measurement. The Coherence function basically asks “What are the chances that the
signal that went into the system became the output signal that we got back as a result of
a linear process?” The answer is returned in the form of a probability value between 0
(no confidence) and 1 (perfect certainty) for each frequency data point. Smaart converts
coherence values to percentages for display purposes, where 100% = perfect coherence.
Although values closer to 100% generally mean higher linearity and better data, it is
important to note that low coherence values do not necessarily mean the data is untrust-
worthy. For example, making acoustic measurements in noisy environments requires
significant averaging, which naturally decreases coherence. Since some of the same
factors that encourage using more averaging, such as ambient noise, also lower coherence,
these factors have a combined effect.
In real-world measurement situations, good coherence can be relative, so it is often
more useful to look for overall trends in the coherence of a measurement than for specific
coherence values. If some frequencies have much lower coherence values than most
other frequencies, you should be skeptical of these results and more confident of the
frequencies closer to the general trend line.
Additional factors that can adversely affect the coherence of Frequency Response data
include: delay between the two signals, insufficient energy in the reference signal at a
given frequency, acoustical influences (i.e., reflections, modes and reverberation), and
ambient or electrical noise. Nonlinear processors such as compressors and limiters in
the measurement signal path can also have a negative influence on coherence and
should be bypassed for Frequency Response and Impulse Response measurements.