
Specifications

EAW Smaart 6 Operation Manual Analysis Modes and Display Types
54
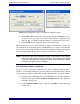
3.3.2 Working with Impulse Response Data
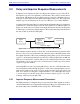
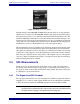
Enter impulse response analysis mode by clicking the IR Analysis button in the main
real-time mode program window. The Impulse Response window opens but the mea-
surement does not start until you click the Start button. The impulse recording routine
performs the measurement and plots the resulting trace according to the parameters set
in the Impulse/Locator tab of the Options dialog and in the Impulse Response window.
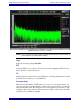
The Impulse Response information can be displayed in the Time or Frequency domains:
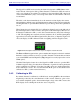
Time: Click the Time button above the graph to plot amplitude (dB on y-axis) vs. time
(ms on x-axis). The default x-axis range is equal to the TC (FFT size/SR) used in making
the measurement but is zoomable.
Frequency: Click the Frequency button above the graph to plot amplitude (dB on y-axis)
vs. frequency (Hz on x-axis). The default x-axis range is equal to SR/2 (Nyquist limit)
but is zoomable.
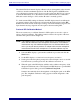
Type Parameters
The Type drop-list sets the y-axis display for the Frequency and Time plots.
Lin: The y-axis amplitude scales values as a linear percentage of digital full-scale.
Log or ETC (Energy Time Curve): The y-axis amplitude scales values logarithmically
in dB.
Lin and Log amplitude scaling are different ways of looking at the same time-domain
impulse response data. Logarithmic scaling is generally the most useful and is the default
magnitude view for the impulse response plot.
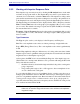
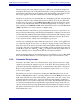
At first glance, the ETC view looks much like the Log view of the impulse response
(IR) but there are some important differences. Two problems with using the IR to find
delays and reflection times are
• the full waveform associated with a single arrival has both positive- and negative-
going components;
• energy with a phase angle of 90° or 270° appears to have an amplitude of zero
on a two-dimensional oscillogram.
So even when the IR is viewed on a logarithmic display, a single event shows up as
multiple peaks with nulls in between. The ETC is the envelope of the impulse response
plotted on a logarithmic amplitude scale. Phase information is discarded and the arrival
of energy from a single source or reflection tends to show up as a single peak. So,
especially when measuring delays in low-frequency devices, the ETC can often provide
more accurate information than the IR.
NOTE: Click and drag a rectangular area to scale both axes to that area. Click on
either axis to reset the range of both axes to the full time and amplitude/
magnitude range.