
Specifications

EAW Smaart 6 Operation Manual Analysis Modes and Display Types
55
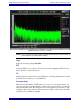
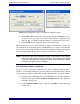
The first large peak on the impulse response or ETC trace is usually the highest in
magnitude and corresponds to the initial arrival time of energy in the impulse response
measurement. The time from the beginning of the measurement to this peak provides
the total propagation delay time (electrical and acoustic) through the SUT.
Smaart 6’s Locked Cursor is automatically set to the highest peak after a measurement
completes, with its location indicated in the cursor readout above the plot. When the
Locked Cursor is present, pressing Shift + Space Bar enters the Locked Cursor time
location as the current Delay Time for the Internal Signal Delay. To display or move
the Locked Cursor, Cmd/Ctrl + Click on the desired time location or use the Find Peak
(Shift + P) function to reset it to the trace’s highest peak.
Note that when the Locked Cursor is present and the mouse cursor is positioned over
the plot, the Cursor Readout provides the time and amplitude coordinates for both cursors
and automatically calculates the relative difference between them. This feature provides
a convenient method of finding time and amplitude differences between the Locked
Cursor position and any other point on the impulse response plot.
Another way of finding the relative difference between two points on a Log/ETC plot
is to click and drag the mouse cursor over the plot, drawing a rubber band. When you
then release the mouse button, the relative time and magnitude difference between the
end points of the line, along with the slope (in dB/s) and the equivalent decay time (T)
for 60 dB of decay (also called T
60
or RT
60
) are displayed in the upper right corner of
the plot. Clicking once on the plot clears the line and other information.
Smaart 6’s Impulse Response measurements are stored as Windows .wav or Mac AIFF
files. Click the Save As button to save the impulse response measurement to a file.
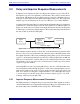
3.3.3 Automatic Delay Locator
Smaart 6’s automatic delay locator finds the time offset (delay) between two input
signals by measuring the impulse response of the SUT. This measurement can be
performed interactively in Impulse mode or automatically in Spectrum or Frequency
Response measurements. The a delay measurement requires both reference and
measurement signals.
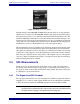
The Delay Auto-Locator is activated by clicking the Auto Sm (Delay Auto-Locate
Small) or Auto Lg (Delay Auto-Locate Large) buttons below the Delay readout (lower
right of the main window). The small and large options refer to the time window used
in the measurement routine. Two options are offered because Smaart’s technique to
find delay times is very sensitive to the SUT’s decay time. The minimum time window
for delay measurements must be significantly longer than the longest delay time you
expect to measure. For best results, particularly when measuring low-frequency devices,
the window should exceed the SUT’s entire reverberant decay time (in this case, the
SUT includes the room).