
Specifications

EAW Smaart 6 Operation Manual Analysis Modes and Display Types
58
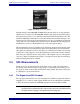
The default Full Scale internal display calibration shows all magnitude values in terms
of dB down from the maximum input level of 0 dB. The Signal Level/SPL Readout
above the input level meters always shows a negative value and dB Full Scale appears
in the field immediately above the numeric readout. When Smaart 6 is calibrated to
SPL, this notation changes to SPL, and the dB value is normally positive.
To obtain accurate SPL readings in Smaart 6, the RTA display must be recalibrated to
an external reference. The signal level readout tracks the input assigned as the SPL
Source in the Audio I/O tab of the Options dialog. It should normally be targeted to the
input channel carrying a signal from a microphone when measuring SPL.
Preferred SPL Calibration Method
The most accurate way to calibrate Smaart 6 to SPL requires an acoustic or piston-
phone sound level calibrator. The calibrator must be fitted to the capsule of the mea-
surement microphone with an airtight seal.
NOTE: If the calibrator doesn’t come with an adaptor that fits your microphone snugly,
check with the calibrator and/or microphone manufacturer. The calibrator
manufacturer may offer additional adapter sizes not included with the base
unit or you may be able to purchase an adapter collar from the microphone
manufacturer that will fit the microphone to a standard calibrator cup size.
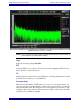
1. Select the RTA display to perform the recalibration procedure and click the
Start button.
2. Set the RTA display to a fractional octave frequency resolution.
3. Set the gain of the microphone preamp and sound card input controls to a useful
level then insert your microphone into the calibrator and turn it on.
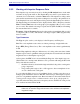
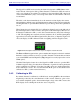
4. When the peak on the RTA display stabilizes at the calibrator frequency, click
the Options/Units button above the Signal Level/SPL Readout to open the SPL/
Calibrations Options dialog and select Calibrate Using Peak.
Smaart 6 automatically finds the magnitude of the highest peak on the RTA
plot. The Amplitude Calibration dialog appears with the magnitude of the
peak frequency.