
Specifications


EAW Smaart 6 Operation Manual Applications
72
4.1 Real-Time Spectrum Analyzer (RTA)
Two-channel real-time spectrum analysis is Smaart 6’s most basic function. Spectrum
measurements are similar to a hardware RTA: incoming signals are divided into frequency
regions and displayed dynamically as magnitude vs. frequency. The default display shows
each channel as a real-time bar graph of energy vs. frequency, each bar representing a
1/12-octave wide band of energy, although many other displays are possible.
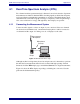
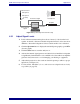
4.1.1 Connecting the Measurement System
Connect an audio signal to at least one input of your sound card. Since two channels
can be monitored simultaneously, a measurement microphone could be connected to
one channel and the output of a mixing console or CD player to the other.
Figure 4-1 RTA measurement setup
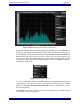
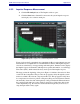
Although any line-level signal may be used as an input source, it is instructive to perform
this introductory measurement with a live mic connected through a preamp. Launch
Smaart 6, select the RTA display type, and click the Start button to begin measurement.
Figure 4-2 shows the RTA display responding to whistling into a live mic. Note the
peak near the fundamental frequency.
Measurement
Microphone
Microphone
Preamp
Computer
CD
Player